Comparison chart templates
Use a comparison chart template to compare tools, vendors, plans, features, pricing, and requirements side by side. It gives your team a structured way to organize notes, review trade-offs, score options, and choose the best fit.
Create your templateSign up to create your own template.
INTEGRATED FEATURES
Recommended apps


Summary
You're weighing options for a new tool, service, or solution, but your notes are all over the place. Some information is stored in Slack threads, while other details are in an email, and you can't remember where you saw that one pricing plan. Whether you're comparing products, pitches, or processes, scattered information hinders decision-making. That's where a comparison chart template can help.
This product comparison chart template makes side-by-side evaluations easier, faster, and more visual. Instead of wrestling with spreadsheets or half-finished comparison tables, use this template to create organized data visualizations that help your team spot patterns, highlight differences, and make confident decisions. In this article, you'll learn:
Who benefits from comparison chart templates, and when to use one
Why a structured template leads to better decisions
How to set up and customize your comparison chart step by step
Which Asana features and integrations make the process smoother
Who benefits from comparison chart templates?
Comparison chart templates benefit any team that needs to evaluate multiple options and make a good decision. They're especially useful for product managers comparing features, project management teams reviewing vendor quotes, and marketing teams choosing between campaign tools.
A social media manager at Asana once shared how her team used this comparison chart template to evaluate content scheduling platforms and found the best fit in less than a week. Whether you're comparing products, pricing plans, or workflows, a template is a straightforward way to bring structure to complex decisions and help stakeholders make informed choices.
When to use a comparison chart template
A comparison chart template is useful any time you're faced with multiple options and need a structured way to evaluate them. Rather than keeping pros and cons in your head or scattered across documents, a template gives your team a single place to organize and weigh the information that matters most.
Here are a few common scenarios where a comparison chart template can help:
Vendor or tool selection: Compare pricing, features, and support options when evaluating new software, platforms, or service providers.
Product evaluation: Line up product specs, availability, and user reviews to identify the best option for your team or customers.
Process improvement: Place current workflows alongside proposed alternatives to identify where you can save time or reduce errors.
Campaign or strategy planning: Weigh different creative approaches, channels, or messaging strategies before committing resources.
Budget and pricing analysis: Organize cost breakdowns, contract terms, and discount structures to find the best value.
If you or your team regularly face decisions that involve more than two or three variables, a comparison chart template can help you stay organized and move faster.
Benefits of using a comparison chart template
Building a comparison from scratch takes time and often leads to inconsistent formatting or missing details. A comparison chart template removes the guesswork so you can focus on the decision itself. Here are the key benefits:
Saves time: The structure is already in place, so you don't have to design rows, columns, or categories from scratch. Just fill in the details and start comparing.
Keeps evaluations consistent: A template ensures that every option is measured against the same criteria, making it easier to spot meaningful differences.
Improves clarity: Side-by-side layouts help your team see patterns and trade-offs at a glance, rather than having to scroll through long documents or emails.
Supports collaboration: When everyone works from the same template, it's easier to gather input, align on priorities, and reach a decision together.
Adapts to different needs: Whether you're comparing pricing tiers, product features, or team workflows, a good template is flexible enough to fit your use case.
Why use this comparison chart template?
A product marketer at Asana shared how her launch team used this free comparison chart template to evaluate messaging tools across different functions. They not only found the right fit but also prevented a costly mistake by identifying a missing feature early on.
This product comparison template simplifies the evaluation of pricing tables, product specs, or visual data. You can create editable comparison charts with built-in collaboration, detailed timelines, and flexible formatting to fit any team's needs.
Here's how this template helps:
Visualize features, prices, or plans in a side-by-side format.
Streamline decision-making with real-time collaboration.
Compare different products or workflows in one place.
Customize charts with tags, custom fields, or bar chart-style tables.
Keep your team connected with detailed ownership and updates.
Asana comparison chart features
Every team compares information in a slightly different way. Some need a high-level view with visuals, while others want to explore the details with a data comparison, whiteboard sketch, or Venn diagram. Here are a few features that help you work the way you think.
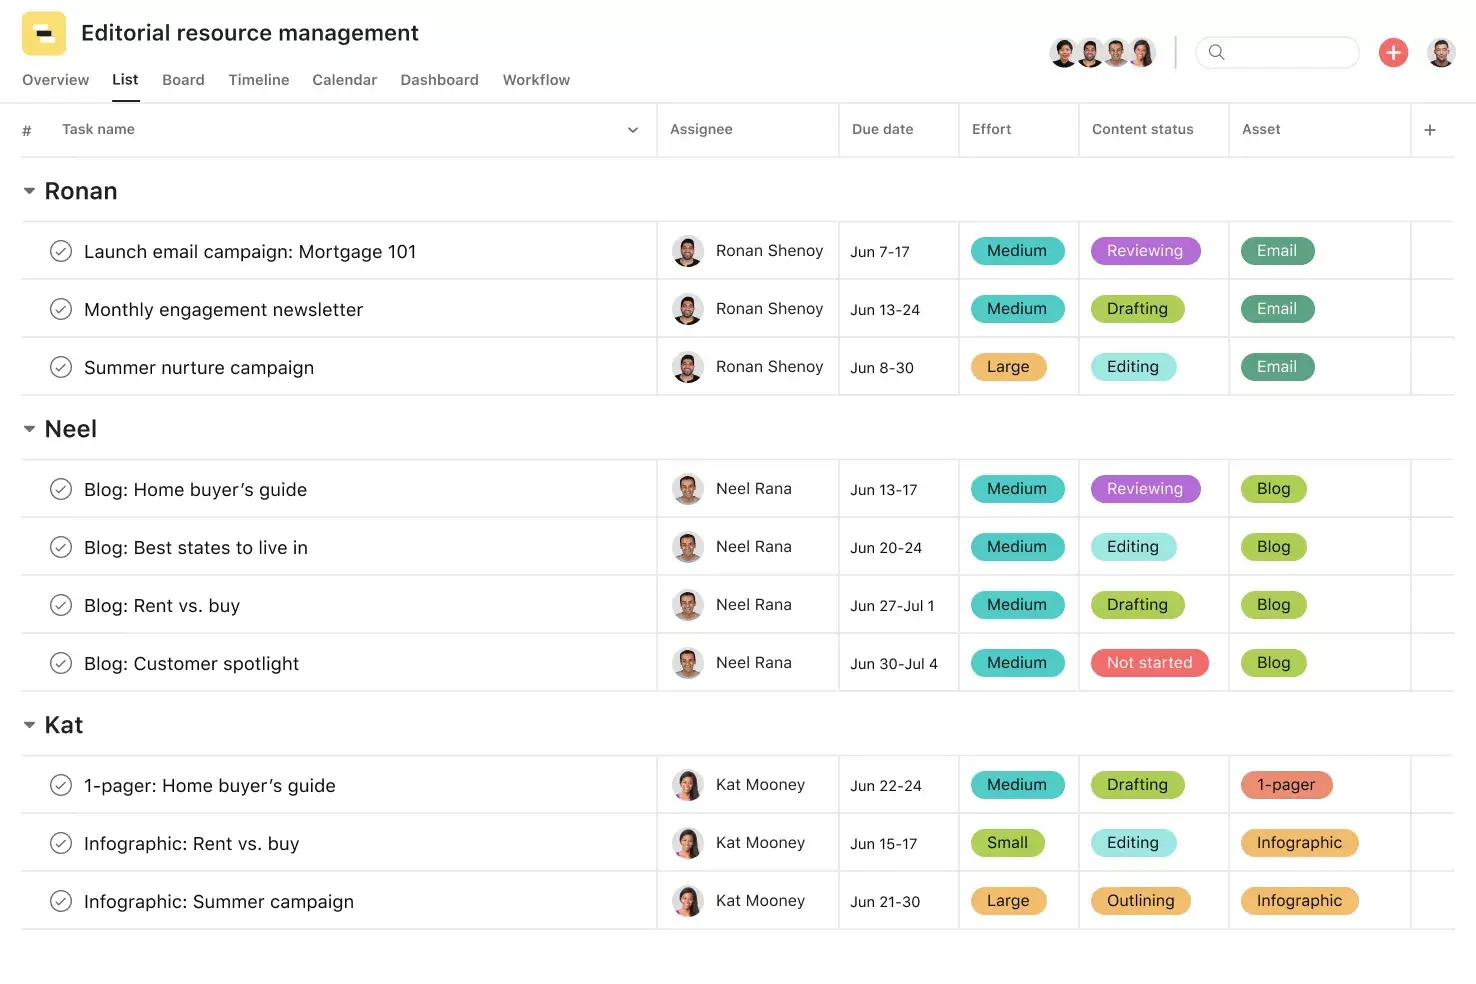
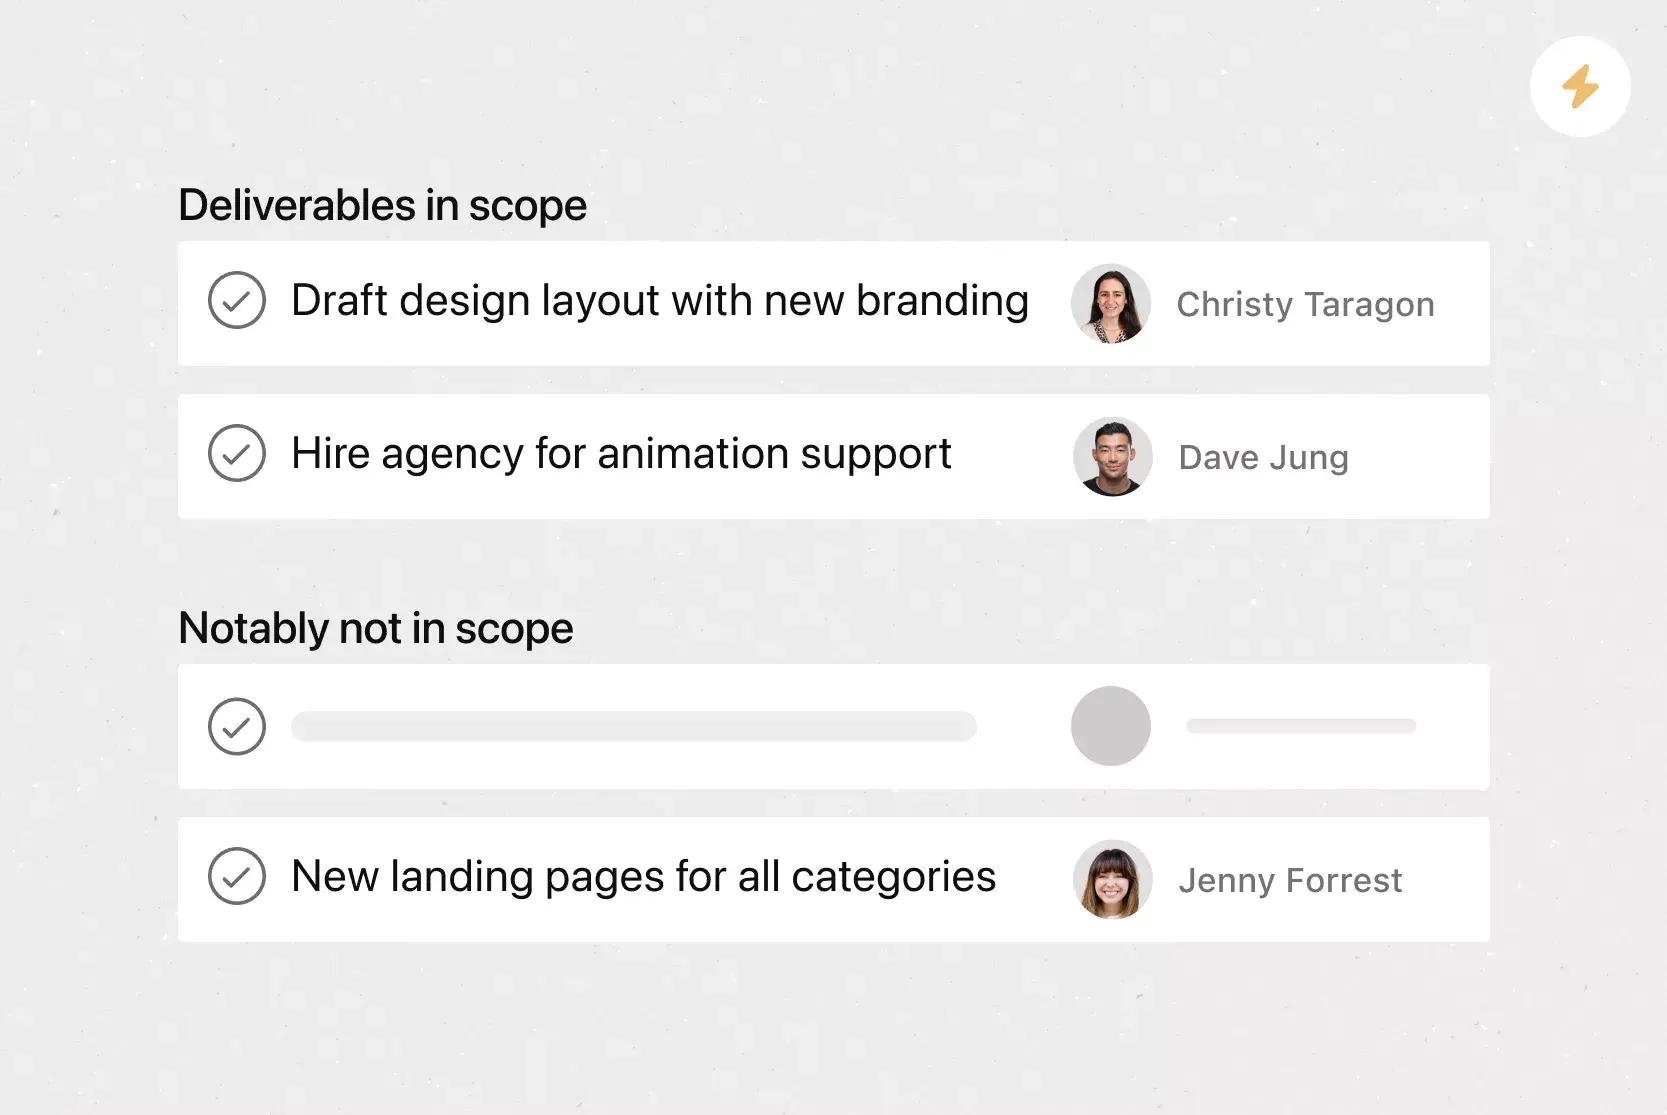
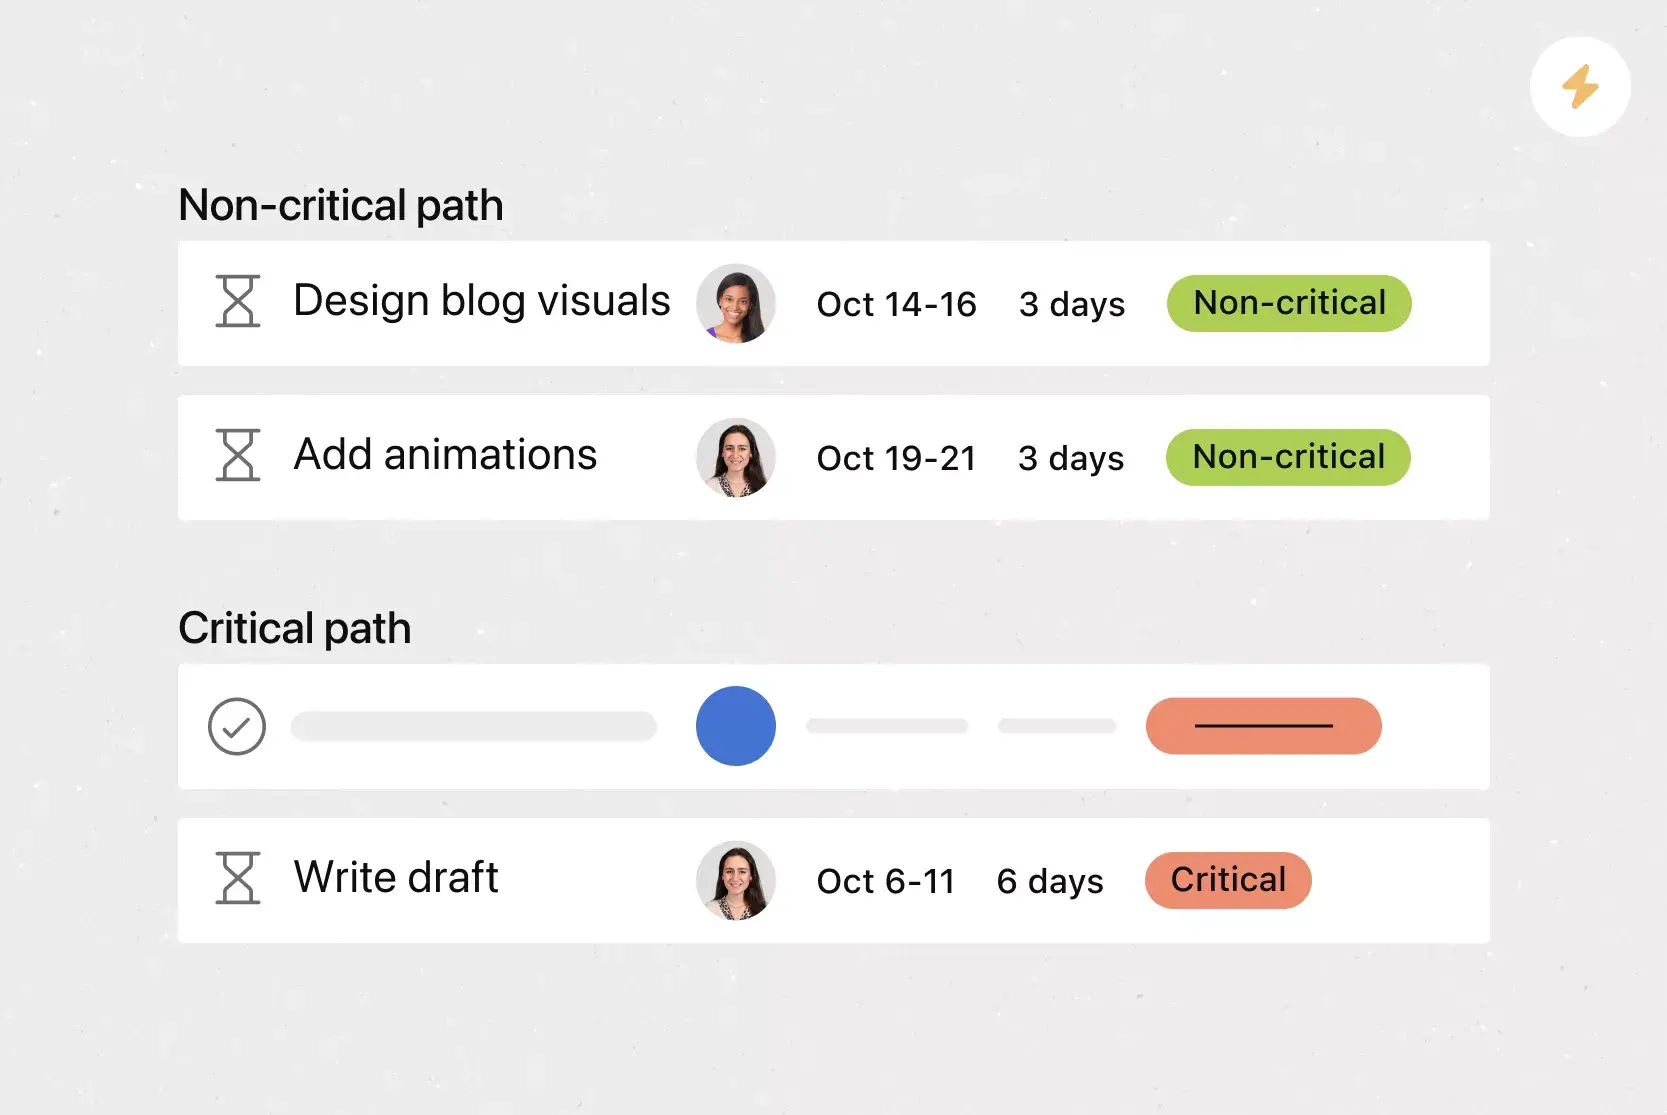
Track key metrics, including cost, availability, rating, or compatibility, using dedicated fields. These fields help structure your comparison data, which makes it easier to scan and evaluate key points. You can configure drop-down menus, text, numbers, or multi-select options based on what matters most to your team.
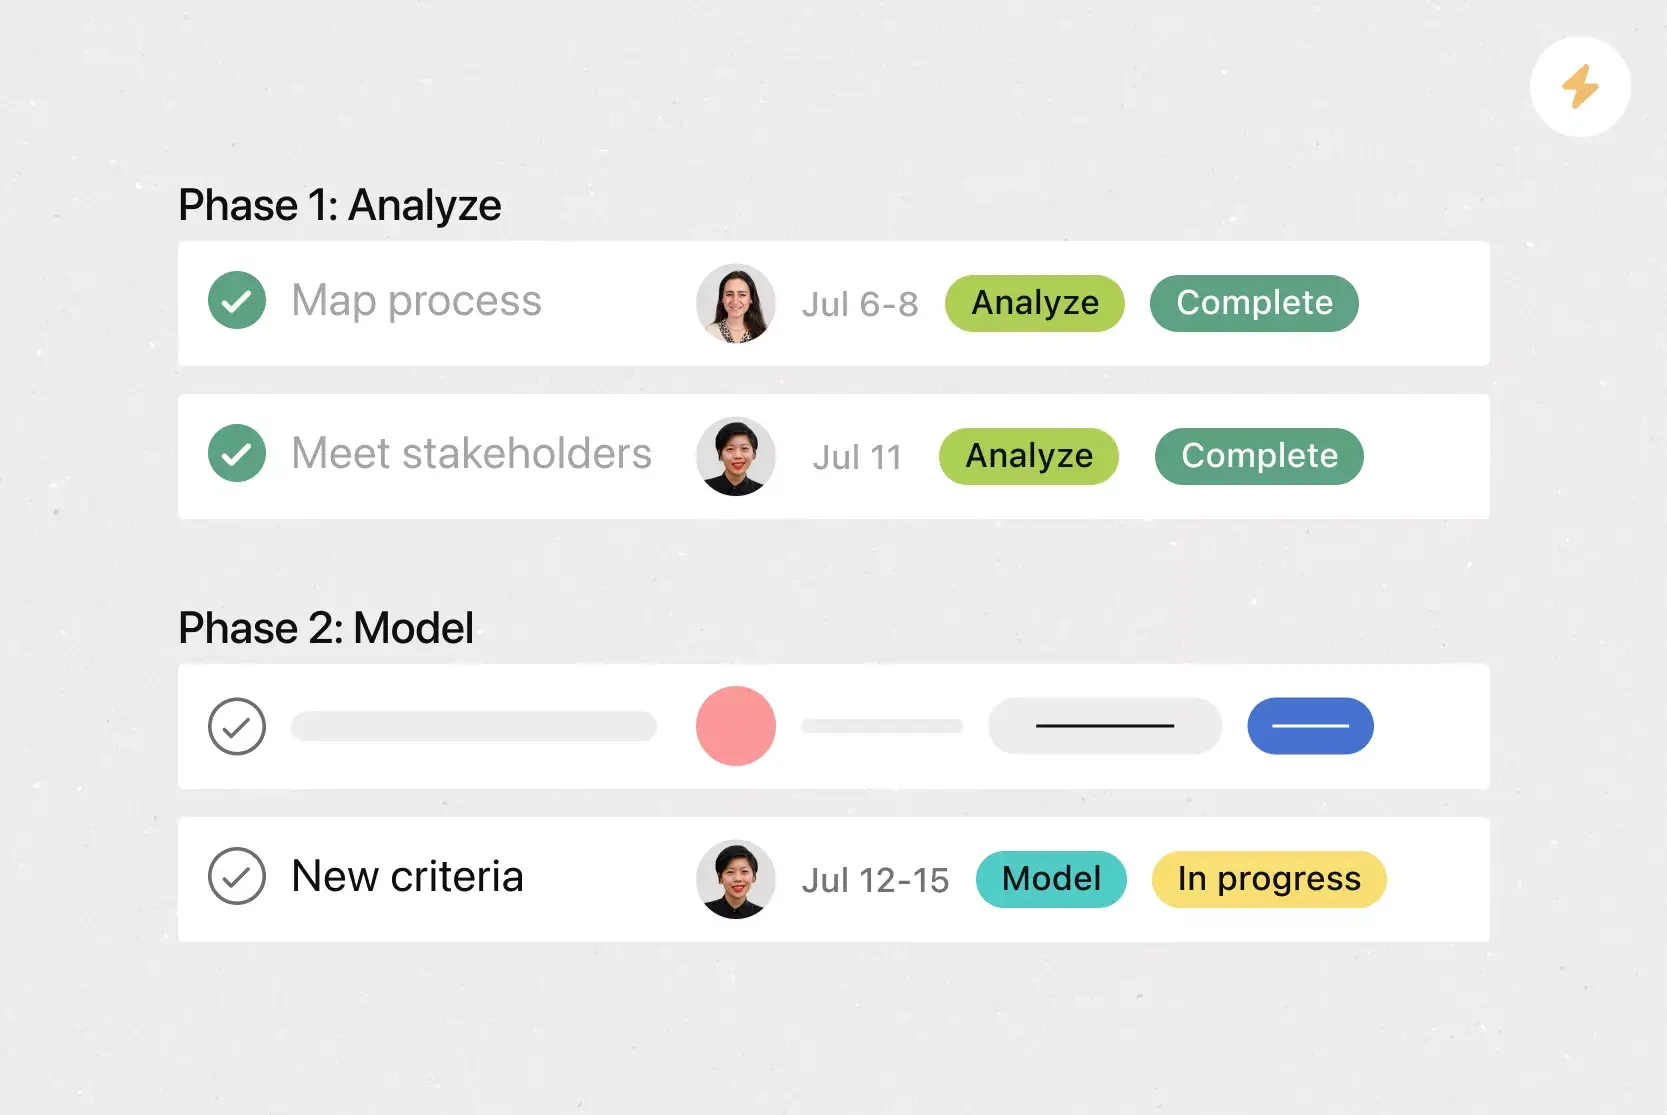
Switch between views to visualize your comparison the way that works best for your team. Each view is fully interactive and supports attachments, comments, and custom fields.
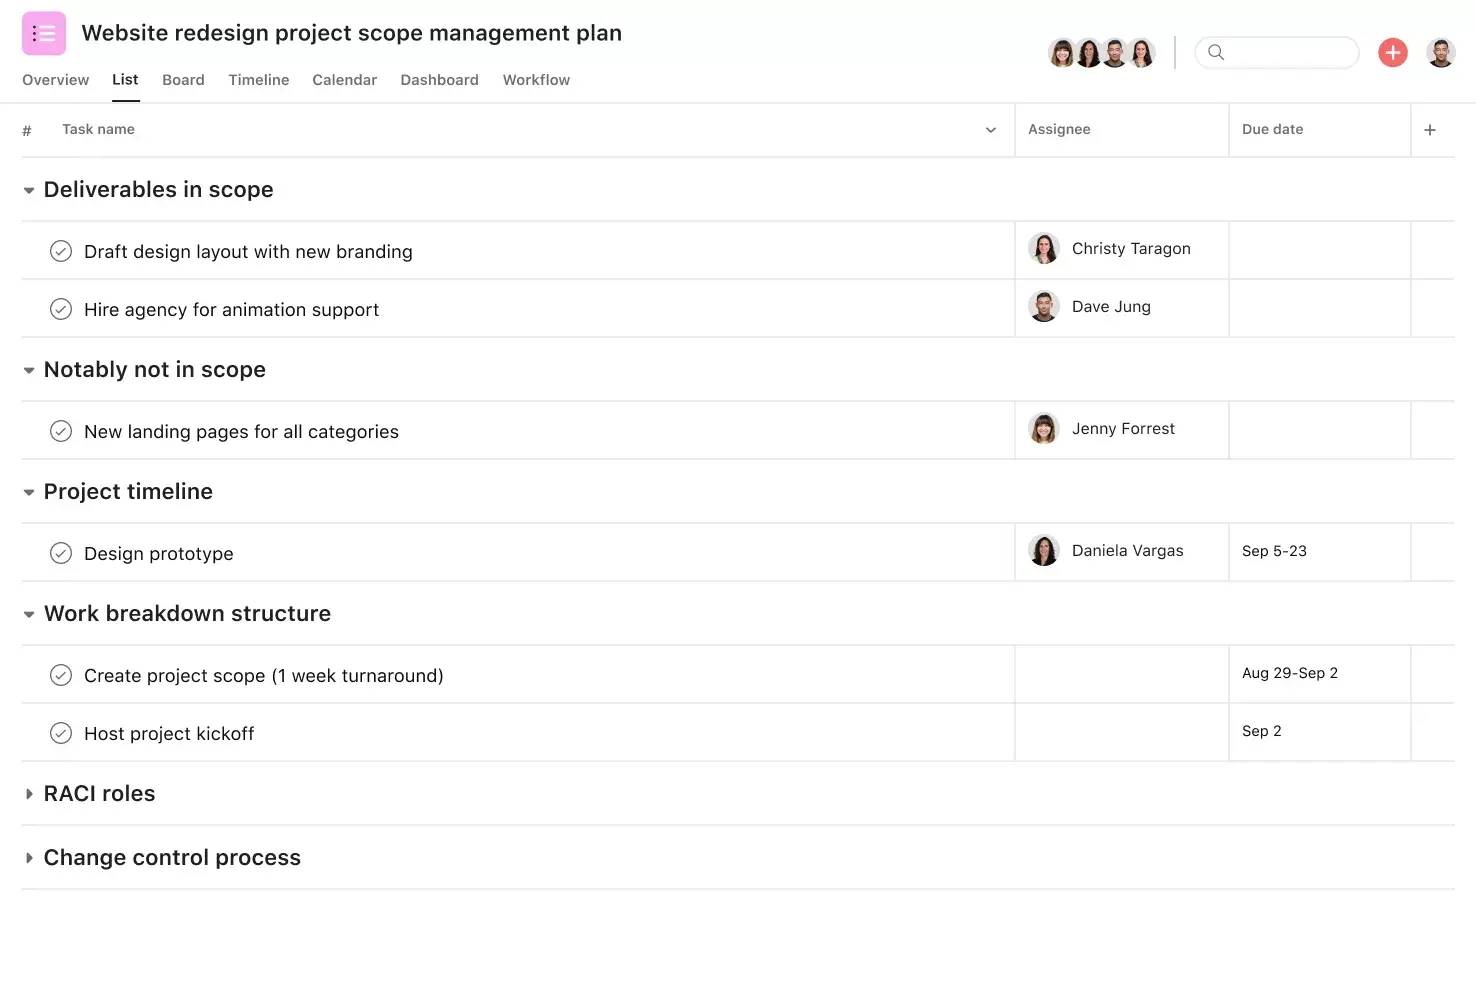
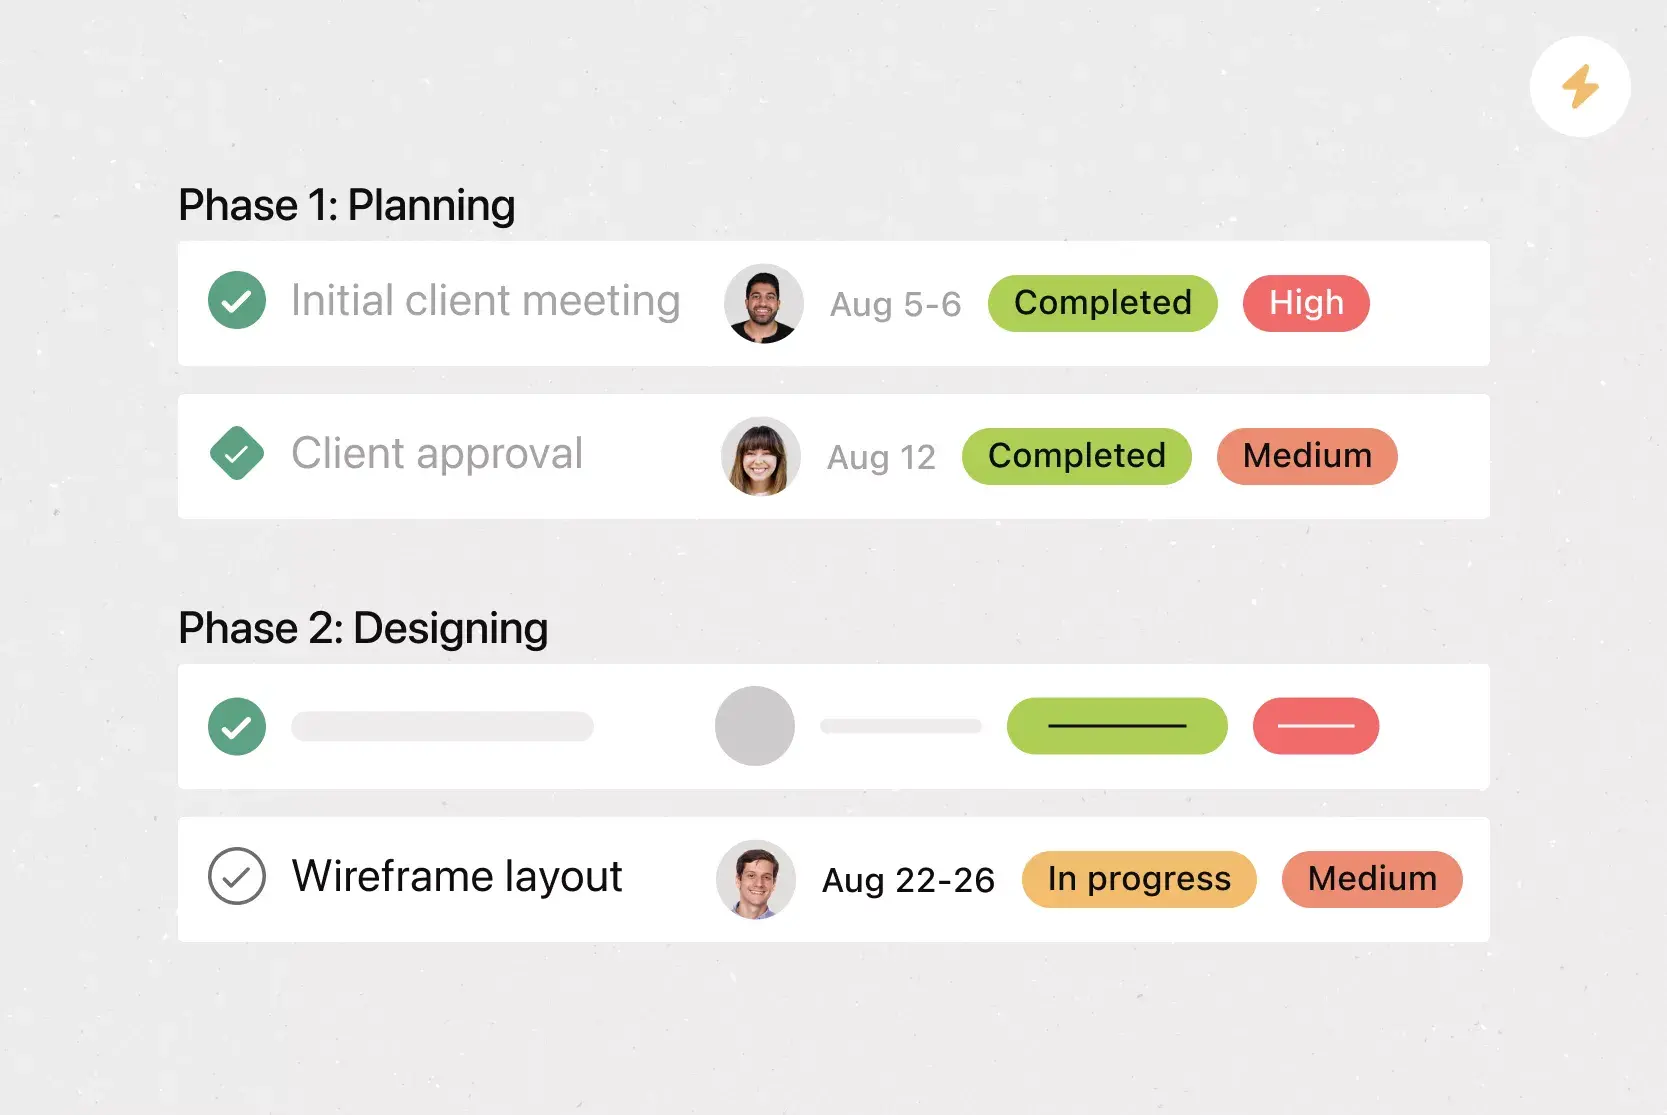
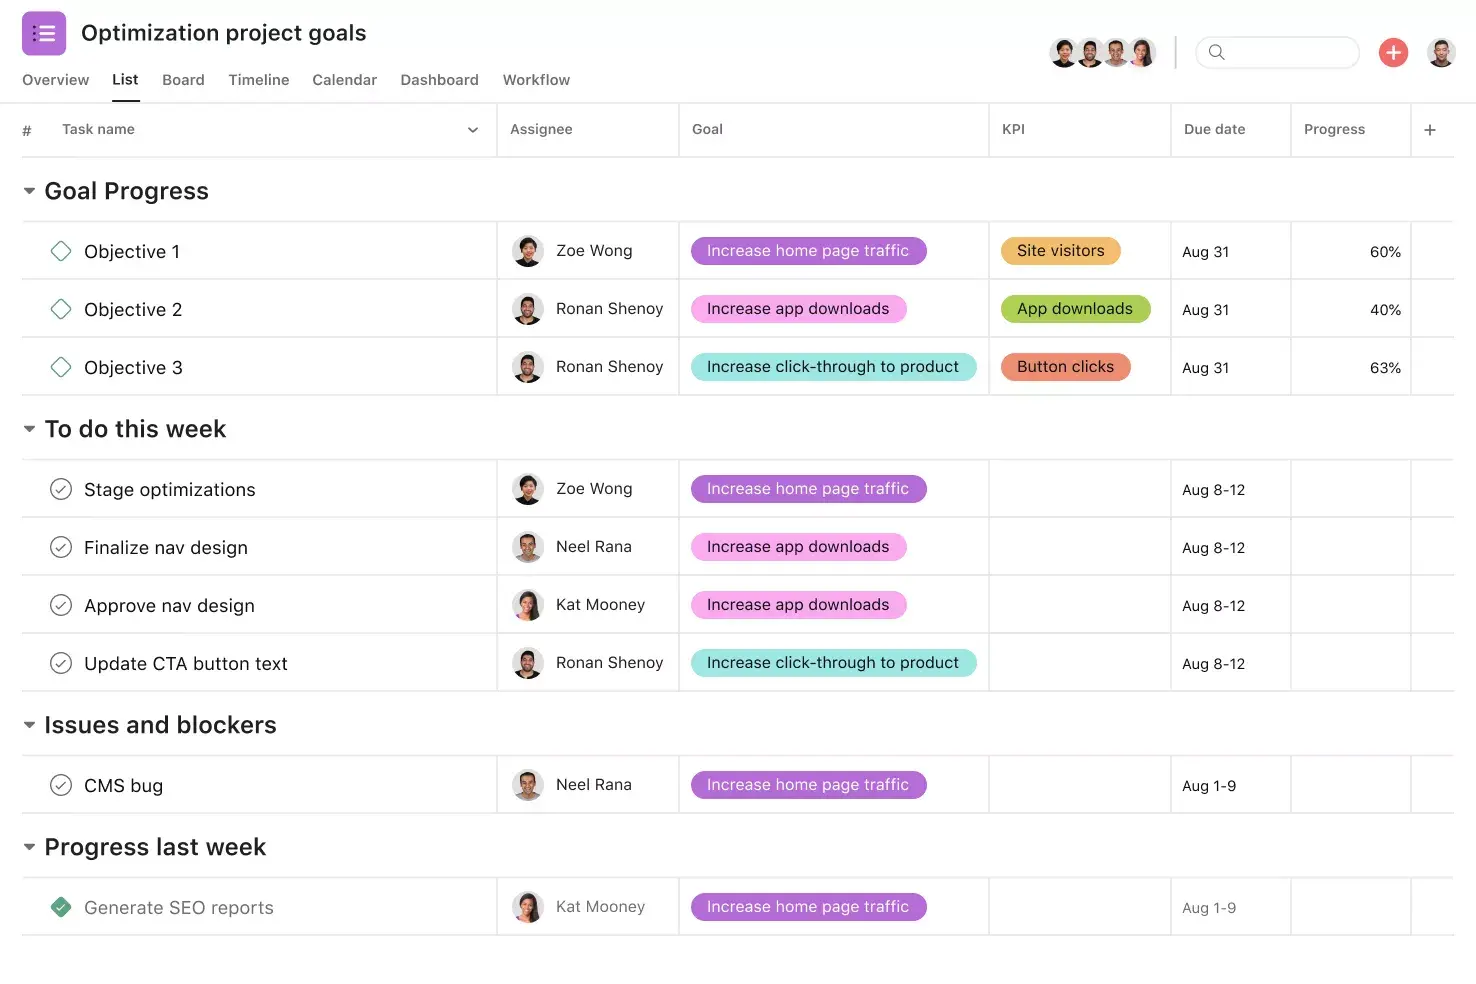
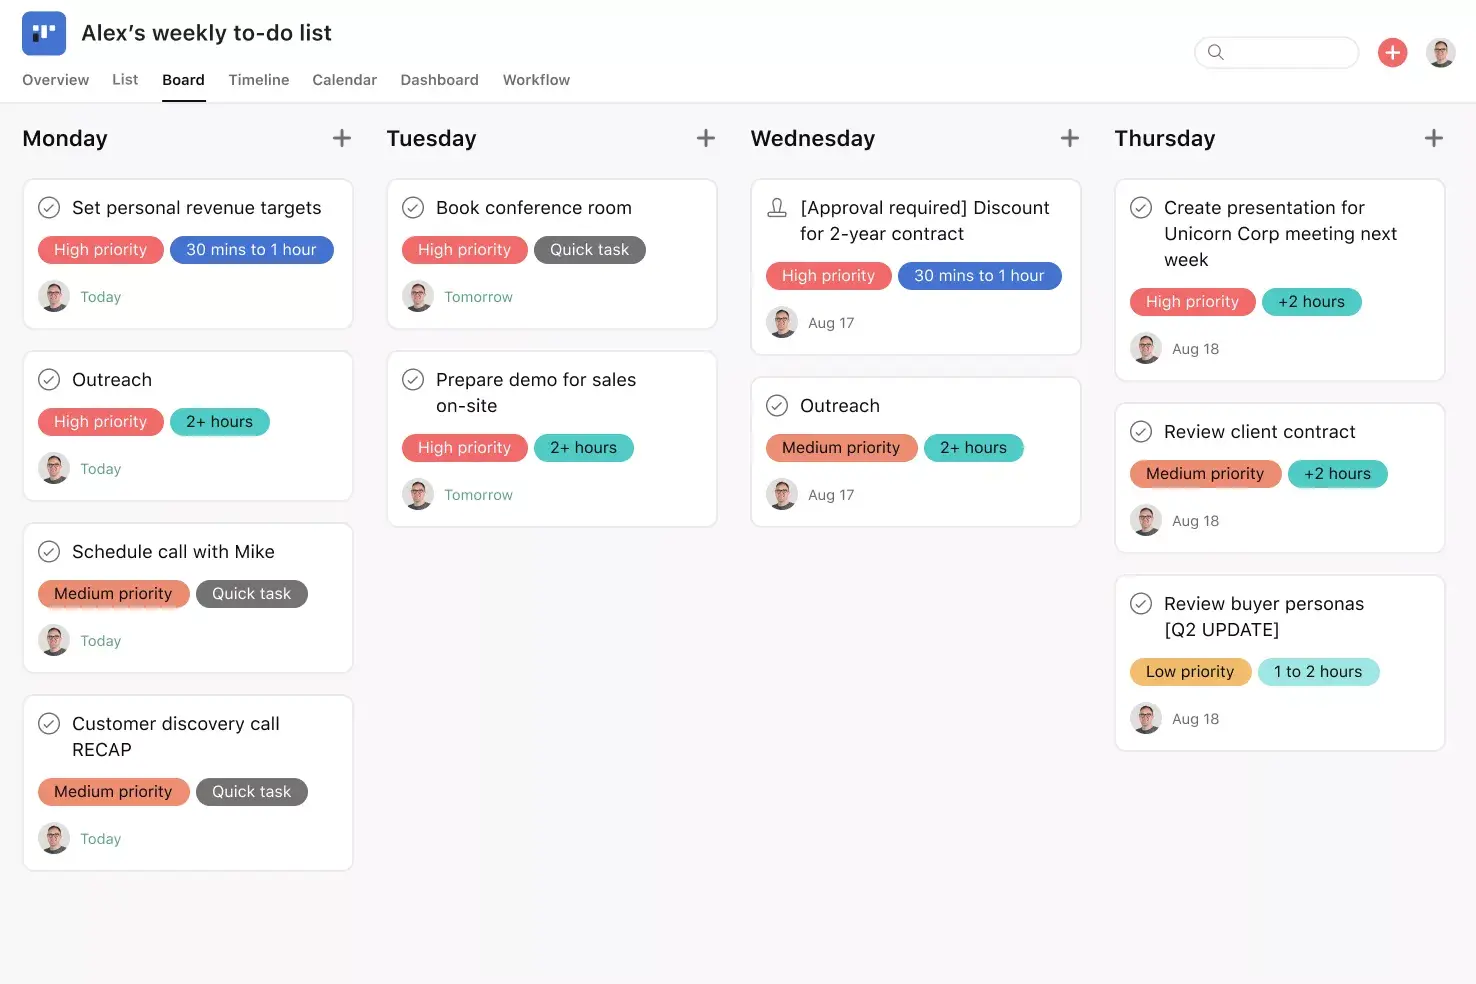
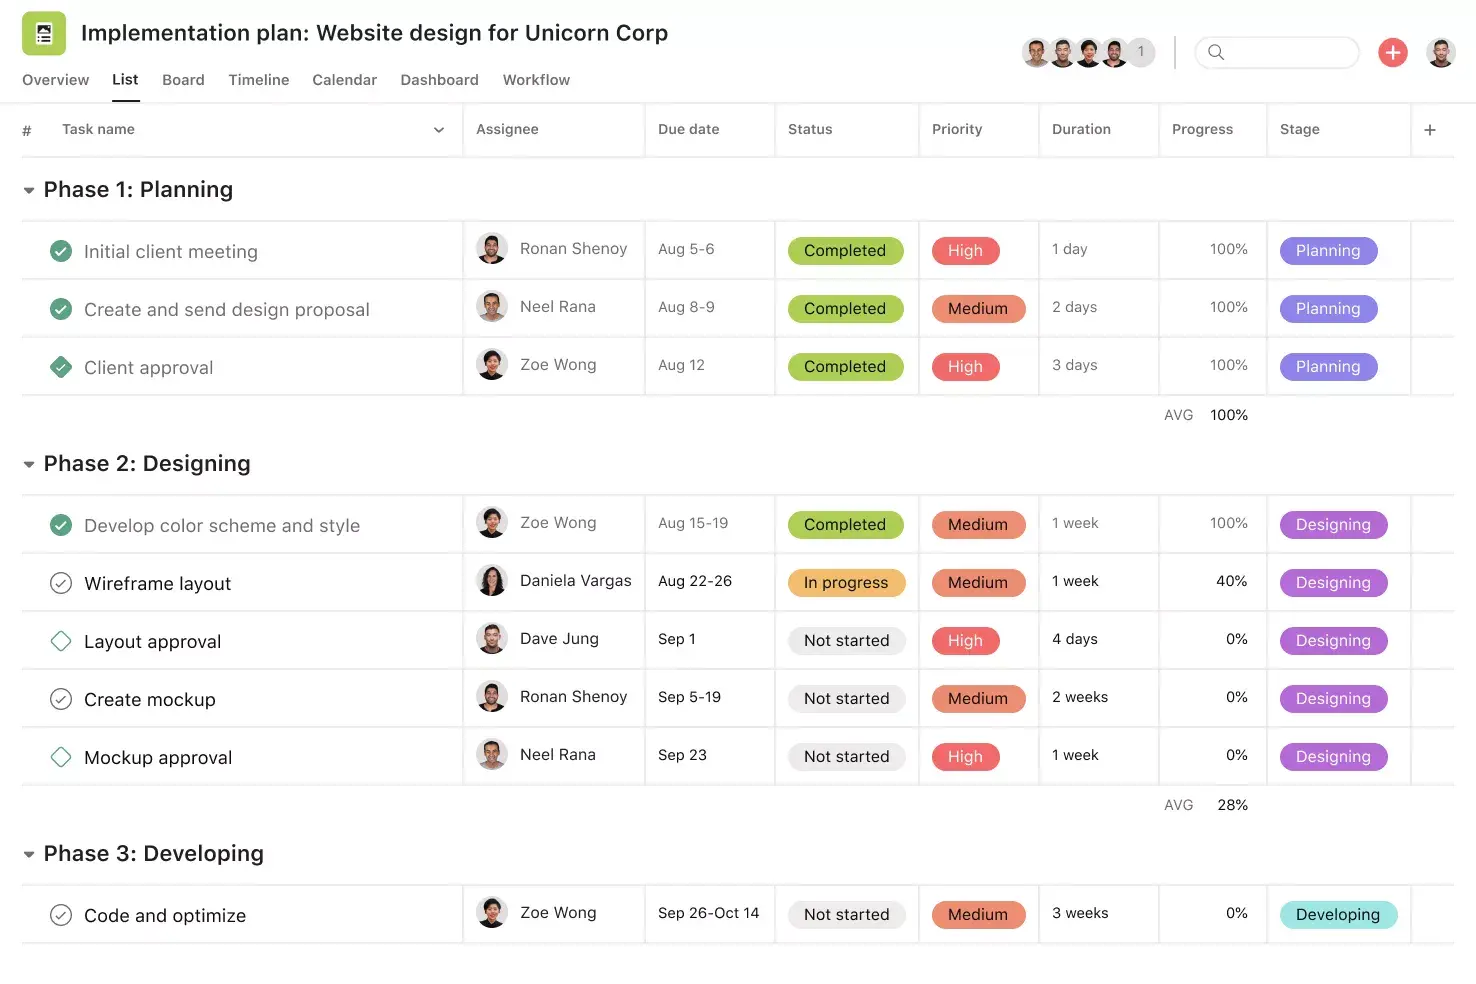
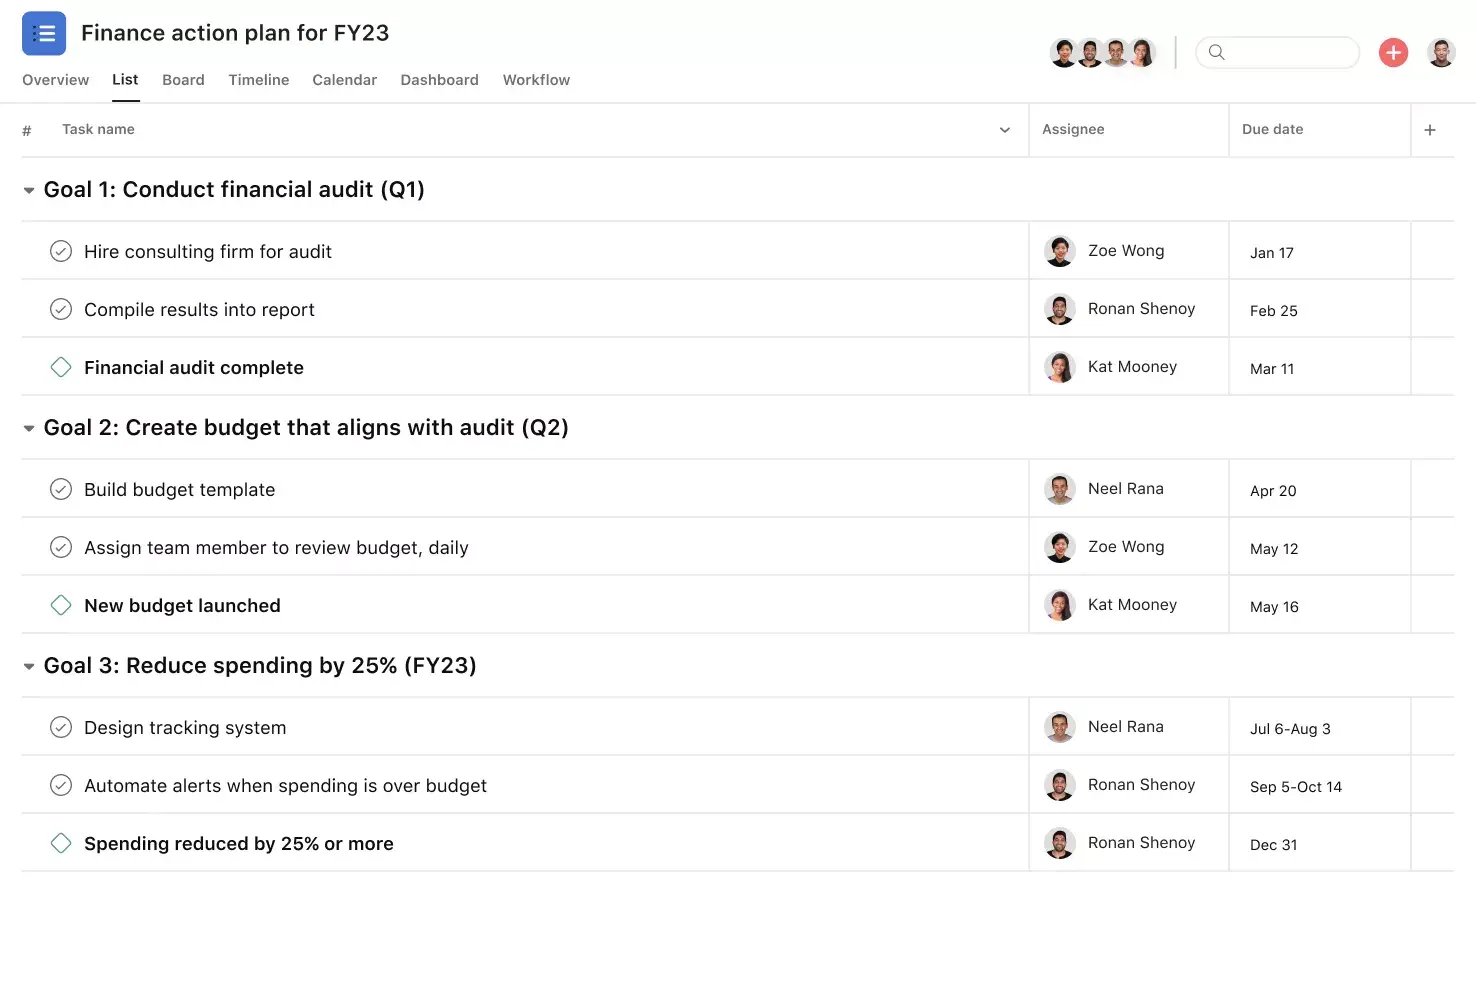
List view: Ideal for structured data and detailed, side-by-side comparisons.
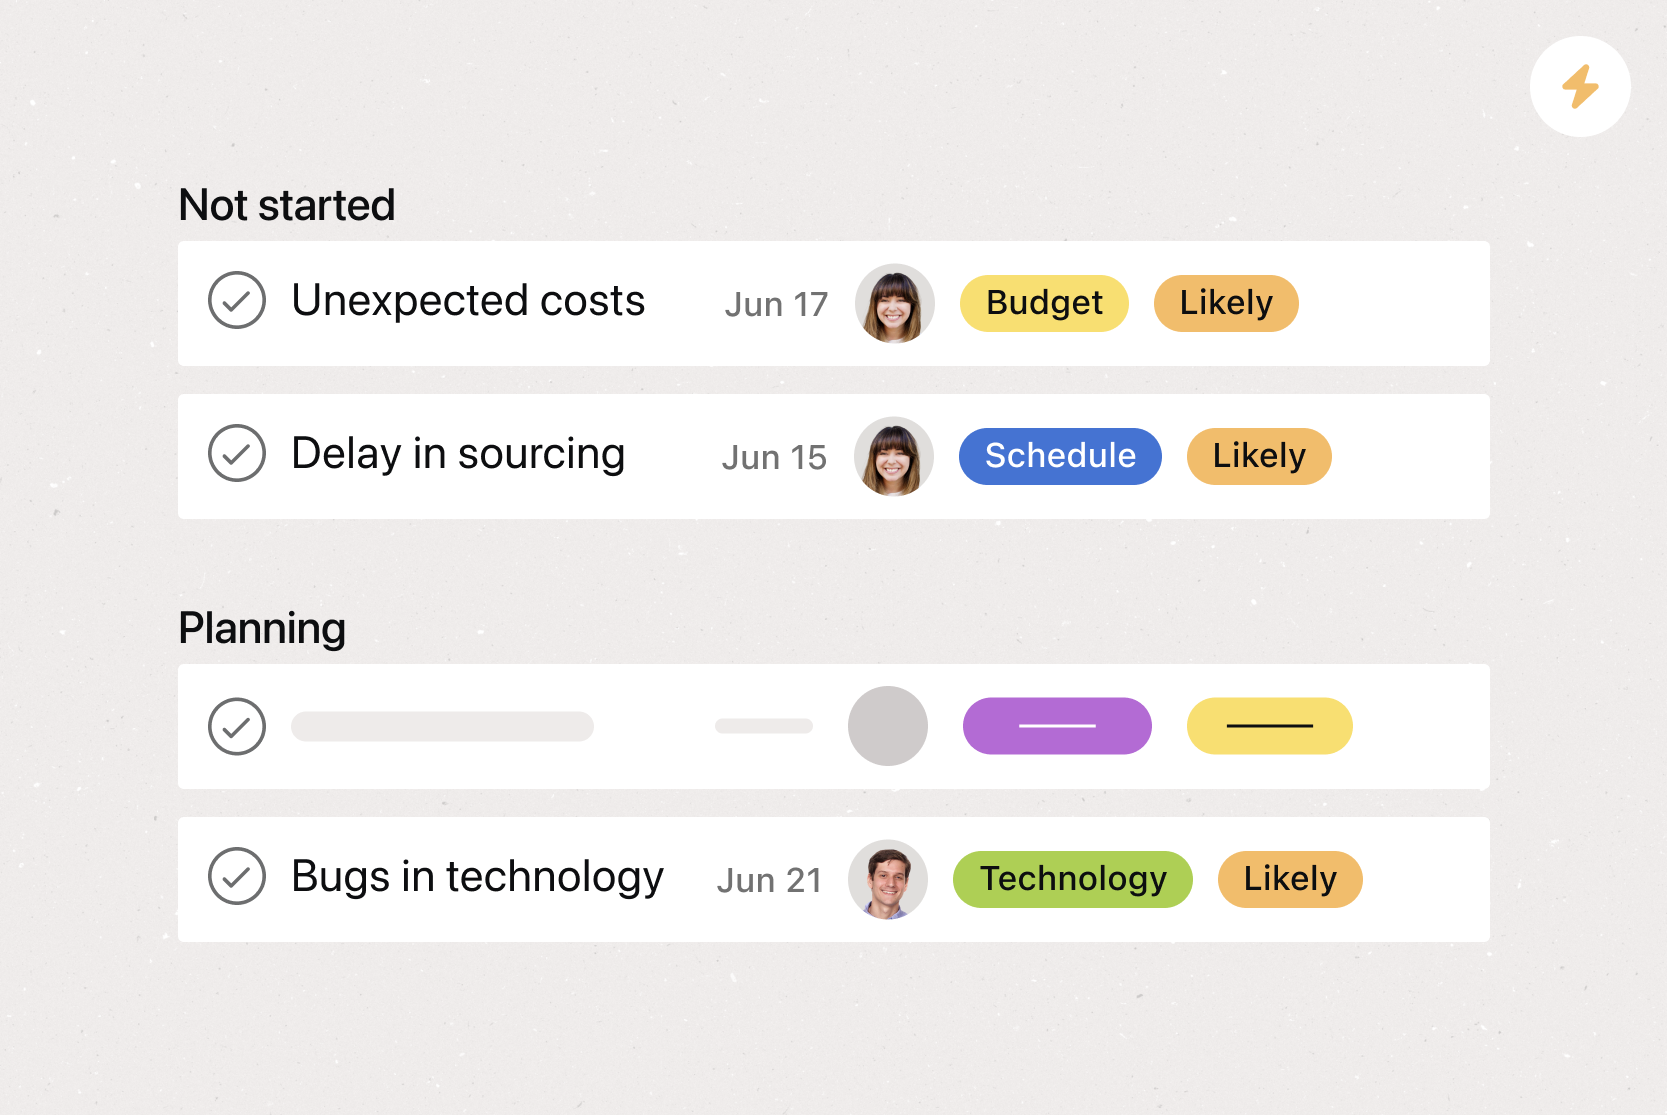
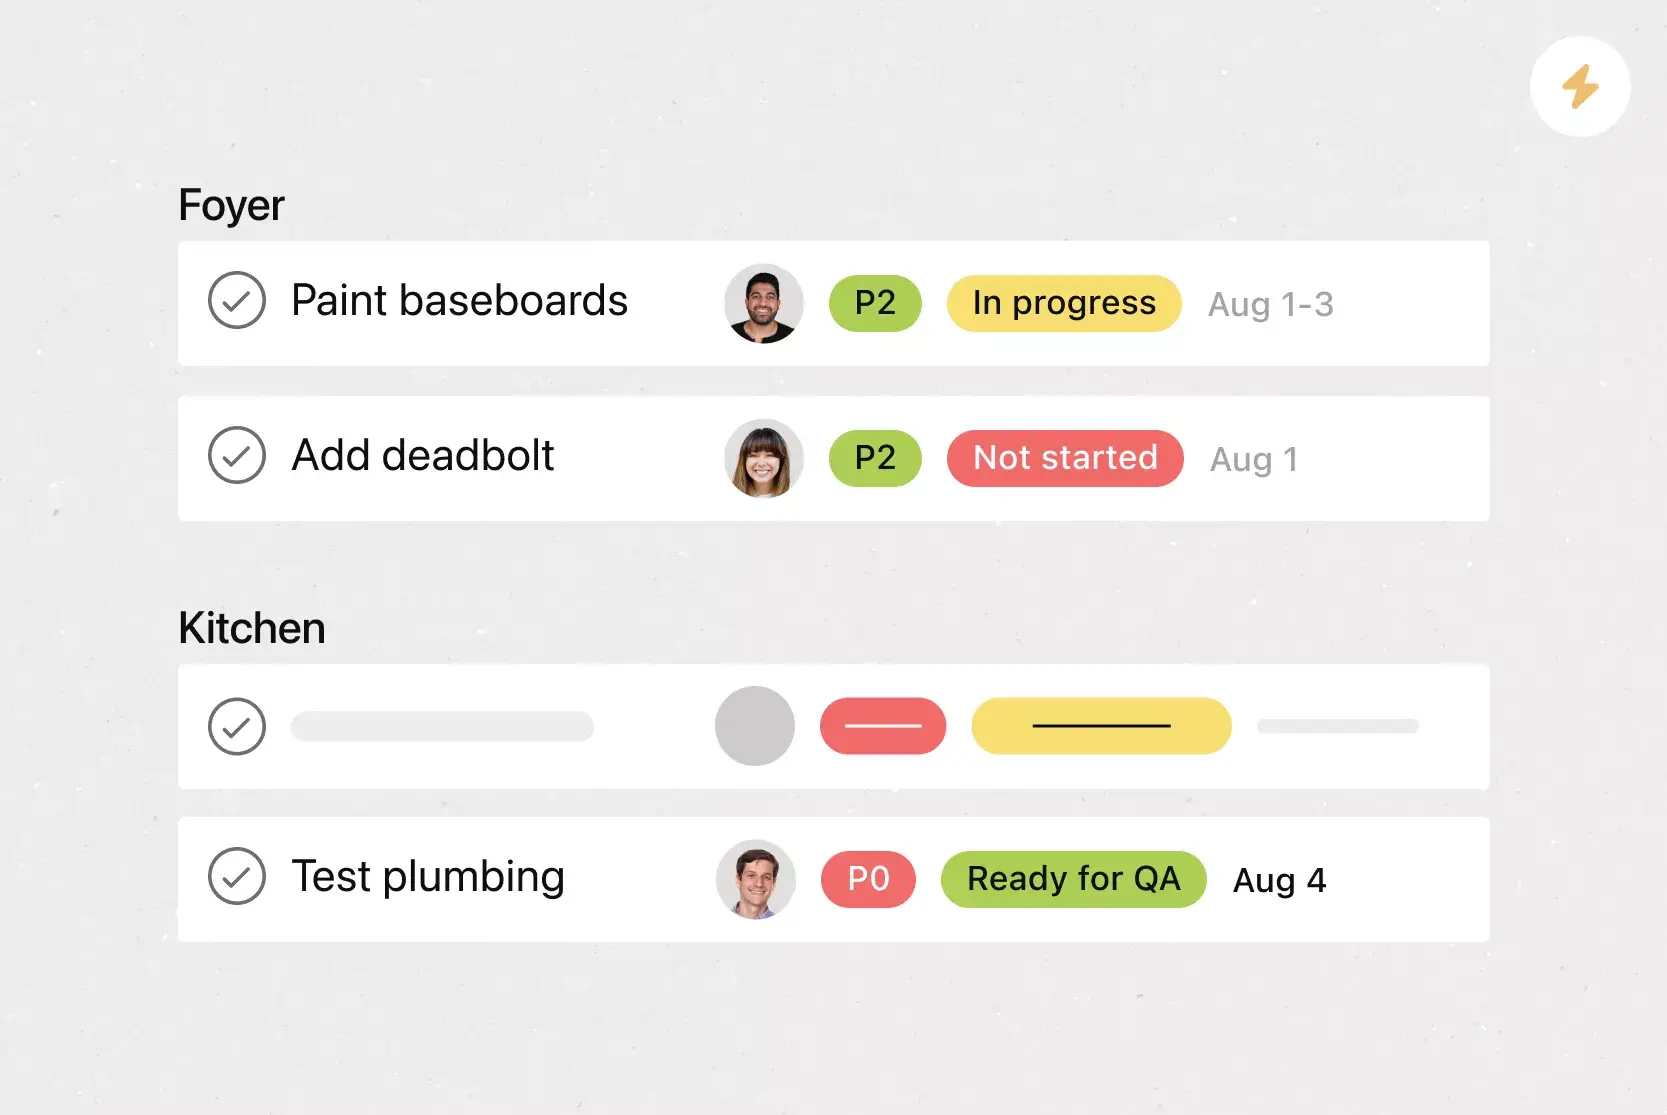
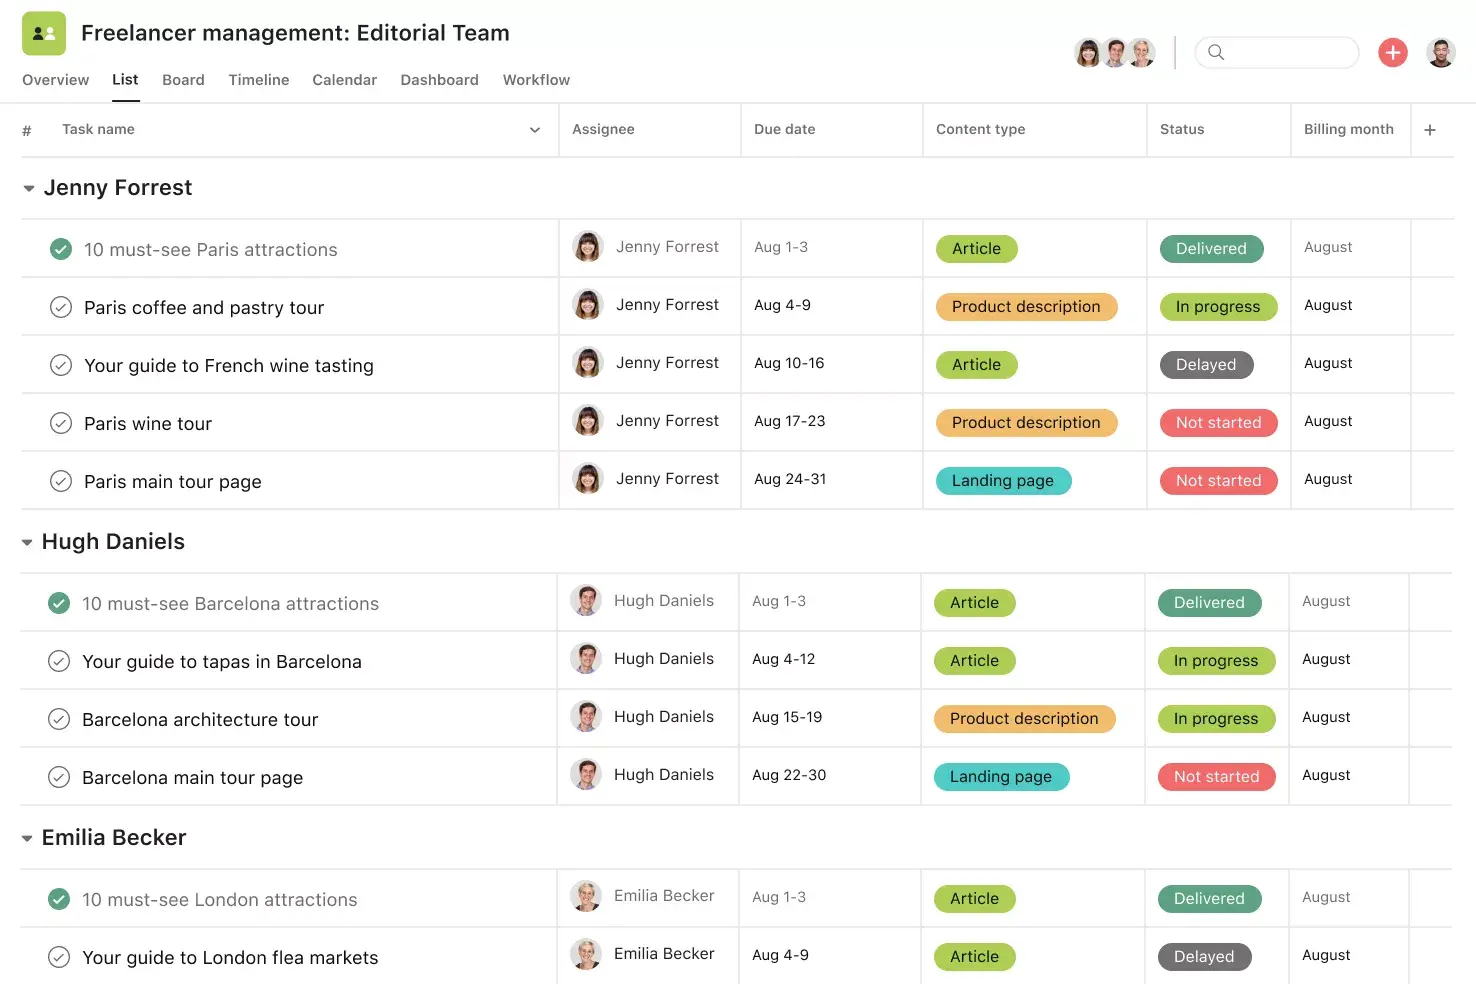
Board view: Helpful when sorting options into categories such as "shortlist," "needs review," or "not viable."
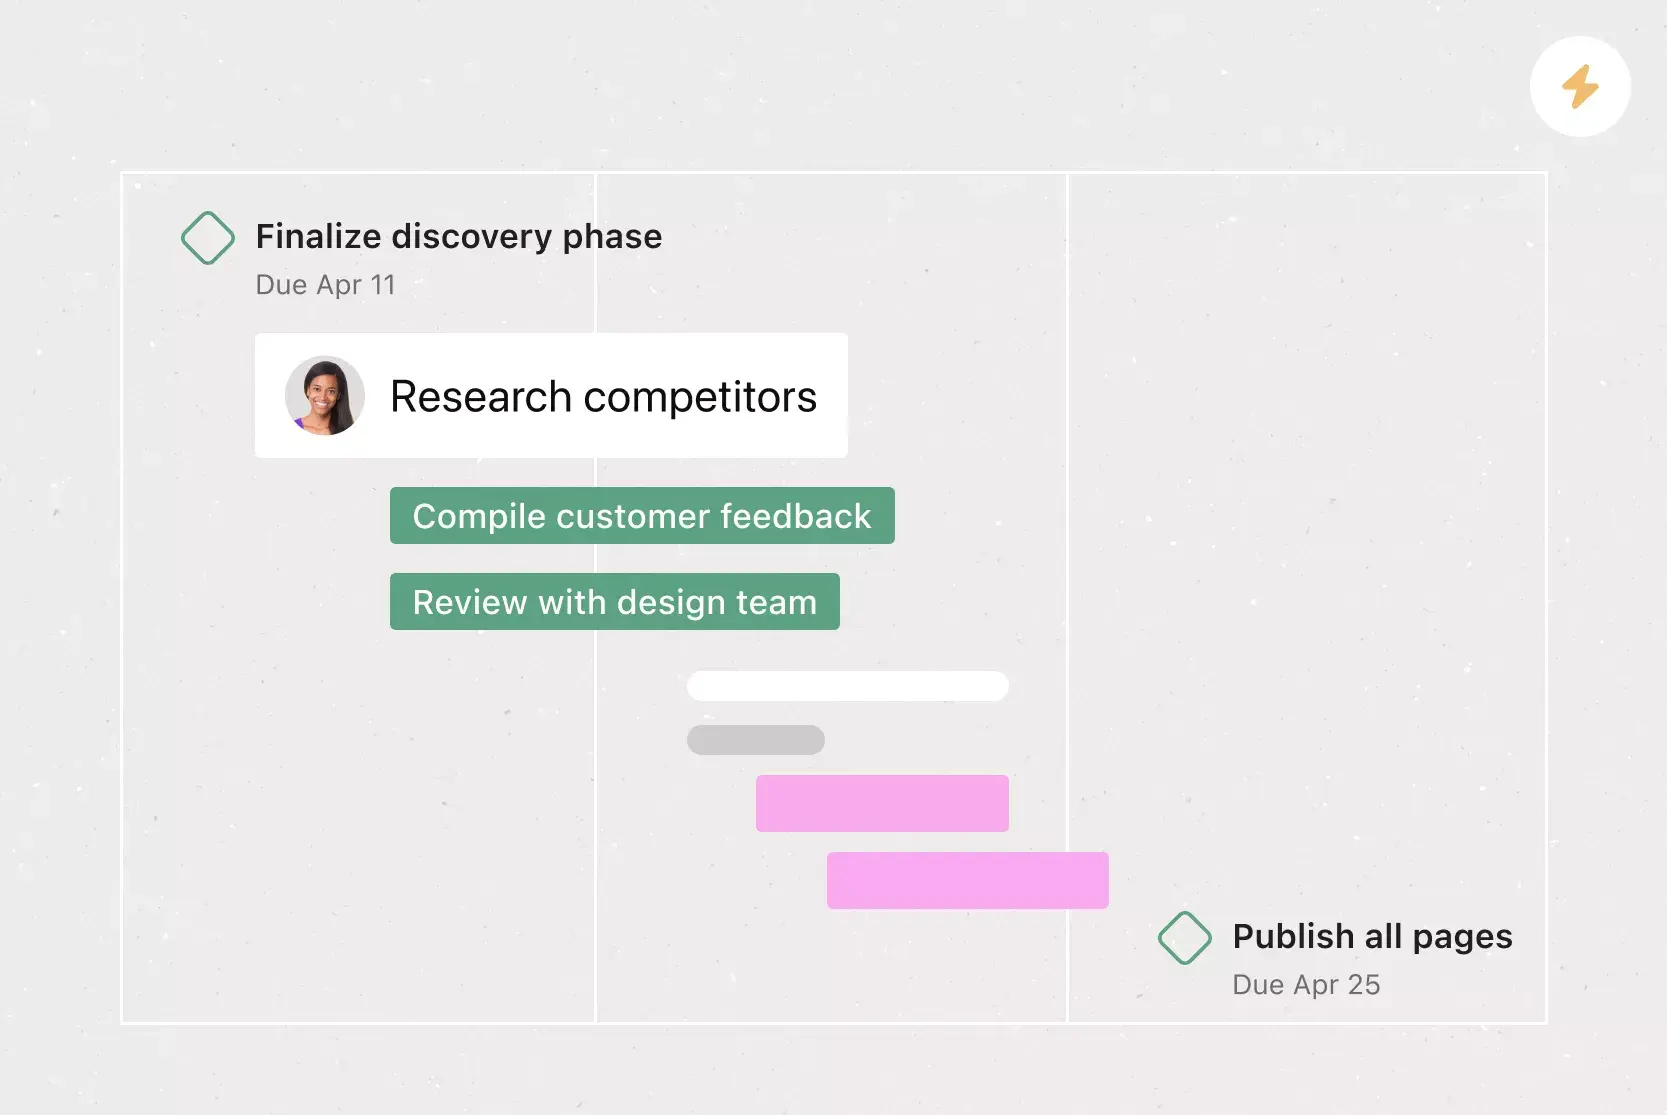
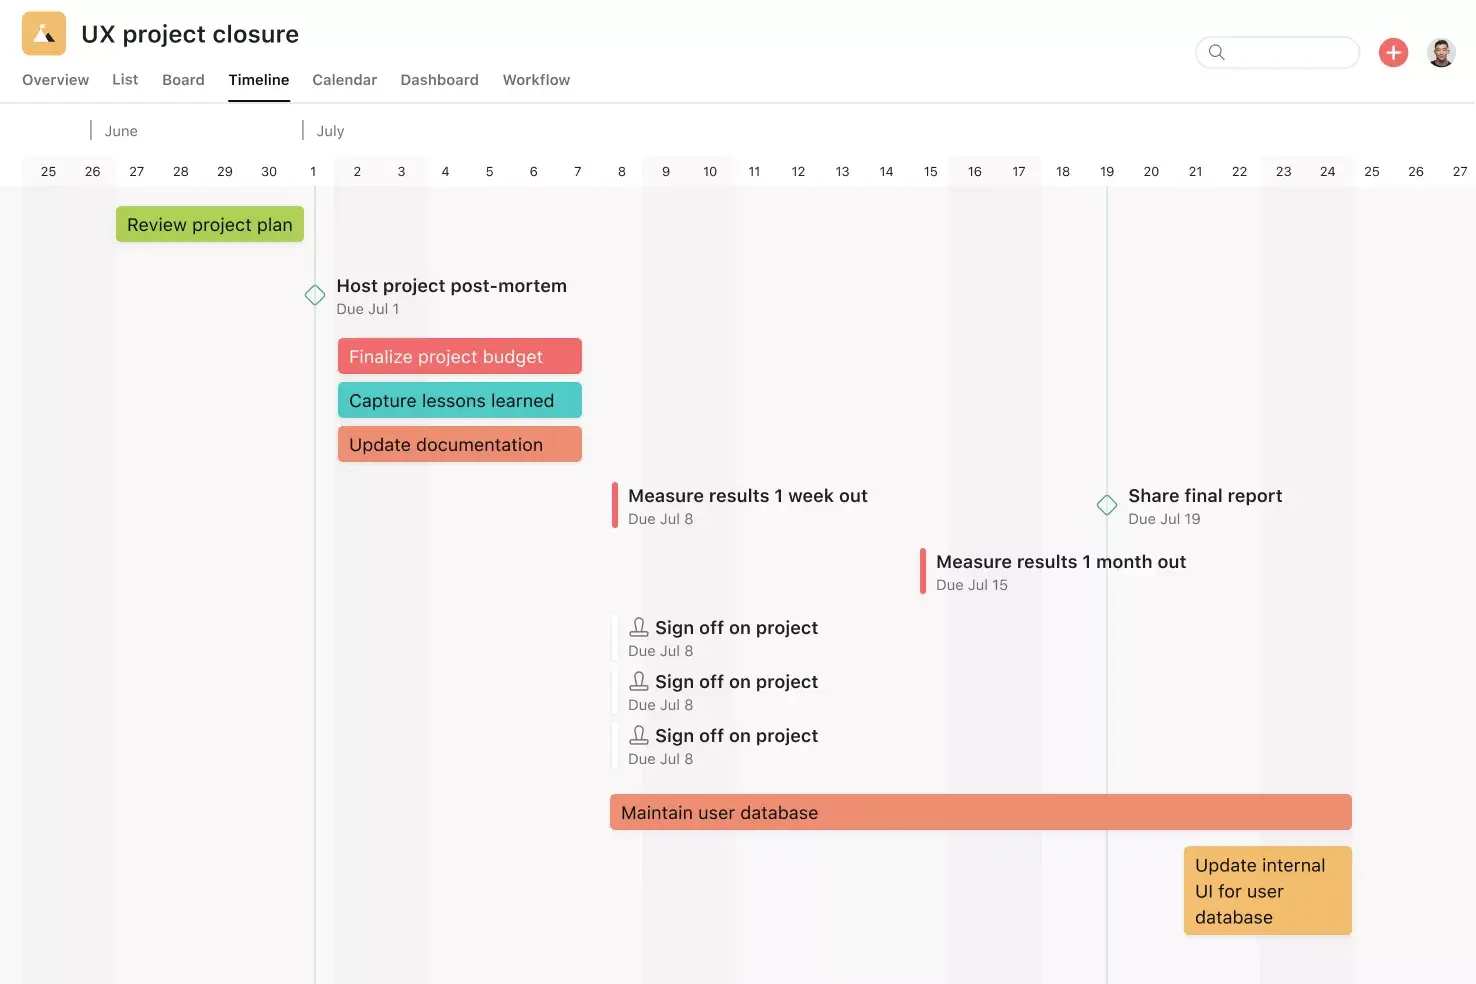
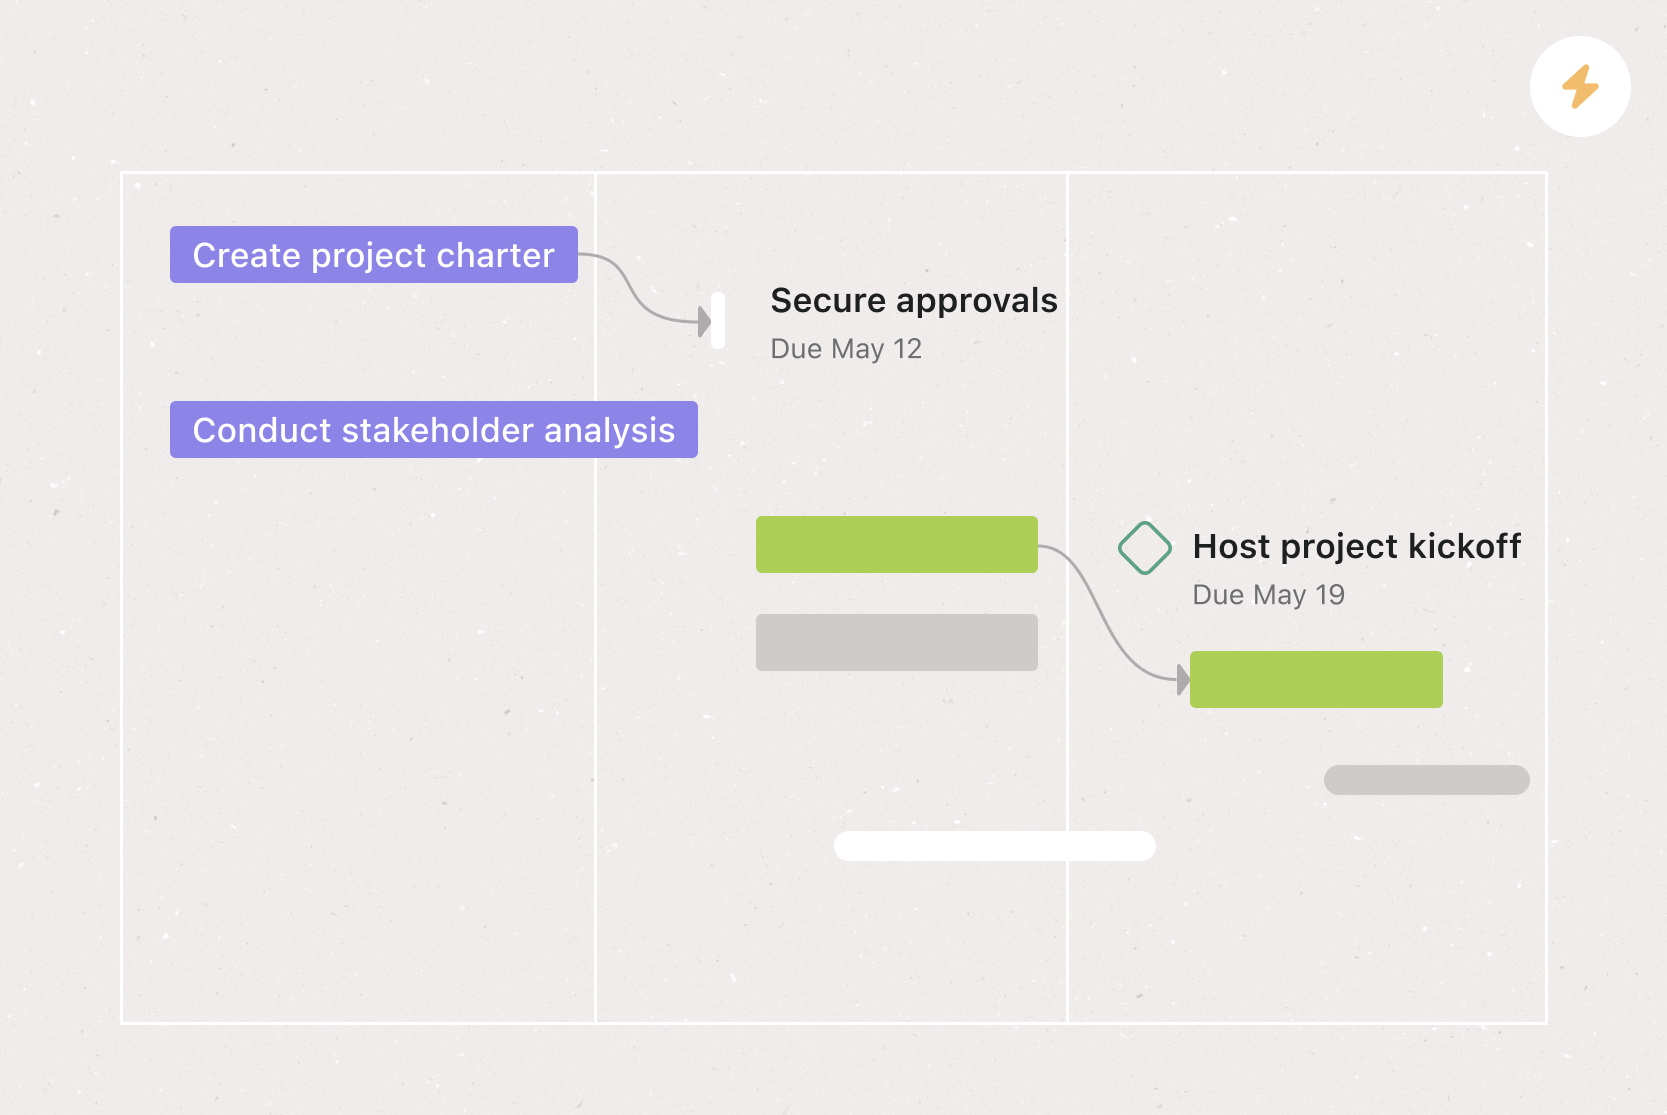
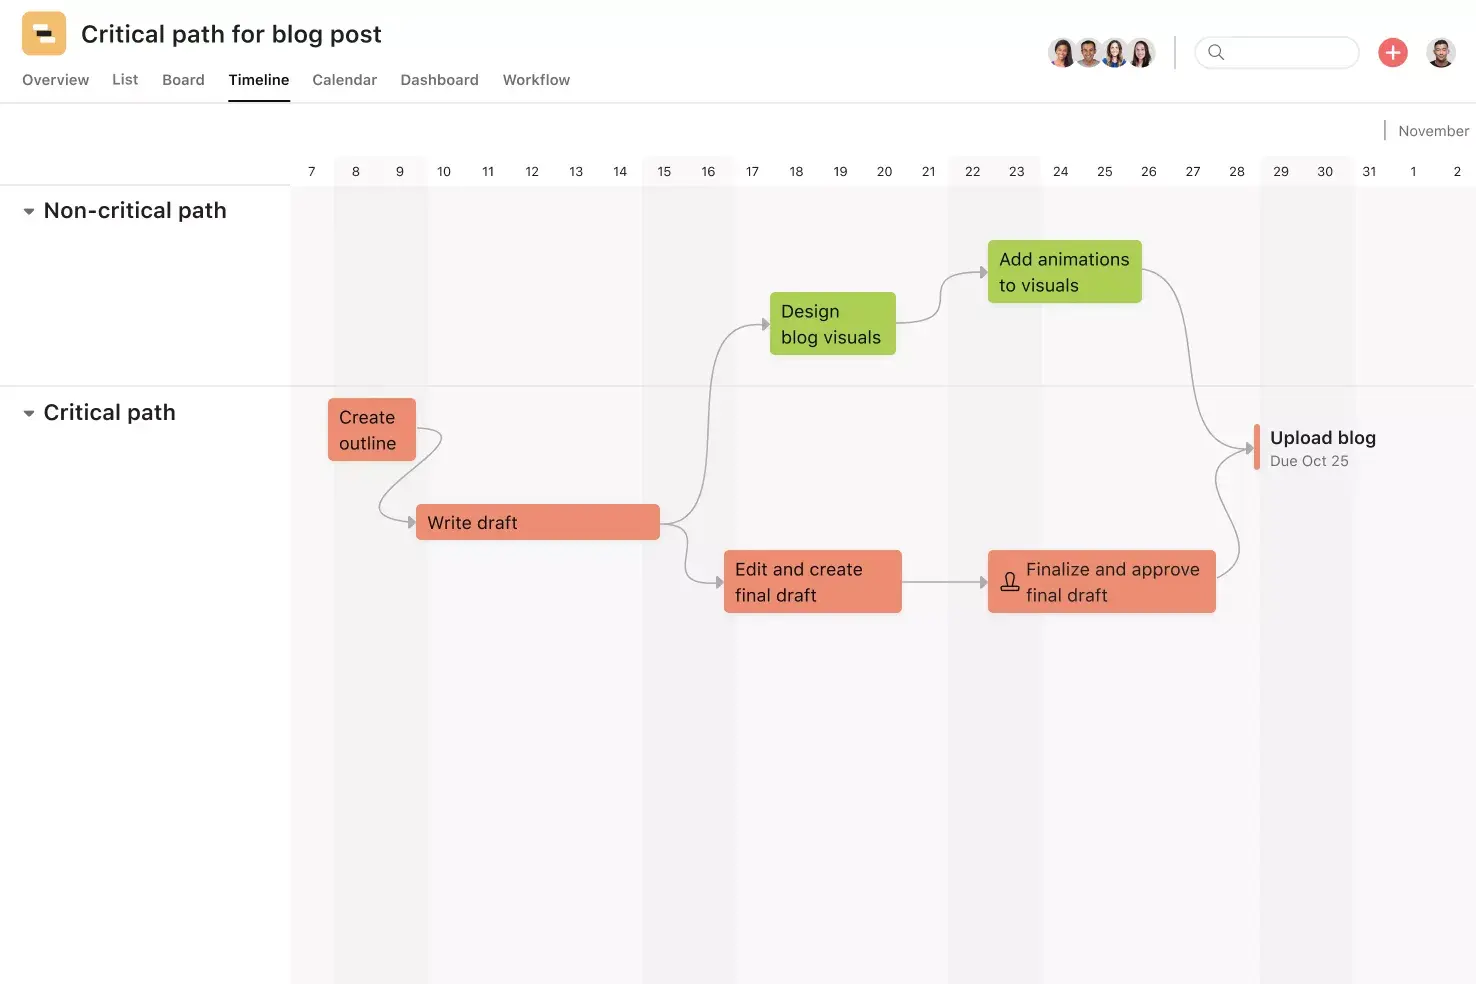
Timeline view: Handy when assessing implementation timing across various options.
Built-in comments make it easy to gather feedback, questions, and context on each item you're evaluating. You can tag specific teammates to review a product, weigh in on a price point, or confirm compliance details. File attachments can be stored directly in the relevant task, keeping your evaluation transparent and avoiding scattered communication across email or chat.
If you regularly conduct comparisons, such as quarterly vendor reviews or annual product audits, you can save serious time by reusing a base project. Asana allows you to duplicate a comparison chart template, preserving all fields, views, and task structure intact. Update the content while keeping your workflow to maintain consistency across evaluations and reduce setup time for future decisions.
Recommended integrations
Asana integrates with dozens of apps that help you compare and present data more effectively. These integrations make it easier to build charts, collaborate across tools, and sync essential updates. You can browse the complete list in our app gallery, but here are a few that work well with this feature comparison chart template:
Automatically sync your data with a spreadsheet to create line charts, bar graphs, or pie charts for more advanced visualization. This integration is ideal for transforming raw comparison data into visually digestible formats, particularly when presenting findings to stakeholders. Use conditional formatting or scheduled data syncs within Sheets to spotlight standout options in your table.
Design a comparison infographic or branded chart directly in Canva, then link or embed the visual in your Asana project for stakeholders to review. Data visualization is especially helpful when you want to present your chart externally or maintain visual consistency across materials. With Canva's templates and drag-and-drop interface, you can highlight differences in a polished, professional way.
Generate powerful visual reports and dashboards using real-time Asana data. Screenful helps you transform your comparison table into organized, presentation-ready metrics without exporting or reformatting anything. Track progress, monitor trends, and share real-time visuals with stakeholders via email or Slack for high-level comparisons across vendors or projects.
Push chart updates to Slack channels to keep decision-makers in the loop. This integration helps you maintain momentum in your evaluation process by notifying the team whenever you update tasks or make decisions. Set up custom notifications for specific projects, comments, or field changes to keep conversation and chart updates tightly connected.
Embed Asana projects directly into Microsoft Teams channels for seamless access to tools, including Excel or PowerPoint. You can convert chats into tasks, review status updates, and collaborate on comparisons in real time without switching tools. The integration also supports project tab views, so your chart stays front and center for teams that already use Teams for communication.
How to use this comparison chart template
You don't need to build a chart from scratch or search for a blank comparison chart template online. Asana's template is ready to use and easy to adapt to any project. To simplify every part of your workflow, browse our full library of project templates for more options.
Step 1: Set your comparison goal
Start by identifying the exact decision you're trying to make. Define the options you need to evaluate, such as different vendors, pricing plans, or features. Use the Overview tab to write down your key criteria and goals so everyone stays focused on the same outcome.
Step 2: Create your chart framework
Choose either Board or List view to start building your comparison chart. In Board view, create columns for each option you're comparing, while in List view, each task can represent an item. Add details like price, functionality, or platform compatibility as task descriptions or subtasks, and attach relevant visuals for quick reference.
Step 3: Add tasks and custom fields
Convert each item on your chart into a task for better organization. Then, add custom fields for pricing, feature sets, pros and cons, or availability. These fields let you filter or color-code your chart to emphasize key differences, and subtasks can break down details such as platform integrations for each product.
Step 4: Loop in collaborators
Tag teammates to review options or provide input based on their area of expertise. Assign task owners to ensure someone is responsible for tracking the details of each option. Use comments to gather feedback and log notes during evaluation, keeping collaboration inside the template so conversations don't scatter across tools.
Step 5: Finalize your decision
Once all data is collected, use views like Timeline or Board to evaluate implementation timing, effort, or dependencies. Add status updates to communicate the current status of each option in the decision-making process. When a choice becomes clear, assign follow-up work or start a new project from that task, and archive or duplicate the chart for future comparisons.
Make better decisions with Asana
When your team has an organized way to compare options, decisions happen faster and with more confidence. This free comparison chart template provides a structure for evaluating any set of choices, whether you're selecting a vendor, choosing a tool, or aligning on a strategy. With built-in collaboration, flexible views, and powerful integrations, Asana makes it easy to compare your options. Get started and see how much easier your next decision can be.
FAQs about comparison chart templates
What is a comparison chart?
Can I use this template for a price comparison chart?
Is this comparison chart template editable?
Do I need design software to make a comparison infographic template?
Is this comparison chart template free?
What is the best chart type for comparisons?
Related templates

![[Templates] Marketing Project Plan (Card) image](https://assets.asana.biz/transform/af70ac54-97b9-4639-b639-be3a3d951e3e/TG23-web-thumbnail-016-stakeholderregister-static-2x?io=transform:fill,width:2560&format=webp)
![[Template] IT project plan (Card image)](https://assets.asana.biz/transform/8aa523a9-4dcb-4053-8e69-7bdf900b48b9/web-product-template-thumbnail-IT-EN-US?io=transform:fill,width:2560&format=webp)

![[Templates] Operations Project Plan (Card)](https://assets.asana.biz/transform/ec3bf1b9-cbcd-413c-a20c-82bf1dbe10d2/TG23-web-thumbnail-008-risk-management?io=transform:fill,width:2560&format=webp)
![[Templates] RFP Process (Card image)](https://assets.asana.biz/transform/14aa111b-ab22-483f-bfd1-3090acb7d2a5/RFP-process-premium-m?io=transform:fill,width:2560&format=webp)

![[HR Project Plan] template Card Image](https://assets.asana.biz/transform/663b8e5e-89c9-4b0b-b48b-1b17e01d1889/TG23-web-thumbnail-033-process-improvement-static-2x?io=transform:fill,width:2560&format=webp)
![[Templates] Waterfall project management (card image)](https://assets.asana.biz/transform/d87fc21c-53f0-4bc9-9094-9789b963be9b/article-project-management-waterfall-project-management-methodology-2x?io=transform:fill,width:2560&format=webp)
![[Templates] Status report (card image)](https://assets.asana.biz/transform/9c82d399-782b-40d3-9eb1-fd7544bef794/article-project-management-project-management-maturity-model-2x?io=transform:fill,width:2560&format=webp)
![[Templates] Event Marketing Plan (Card image)](https://assets.asana.biz/transform/6c7b9329-b612-4732-910a-7917fa079f0b/TG23-web-thumbnail-014-project-chart-static-2x?io=transform:fill,width:2560&format=webp)

![[Templates] Communication plan (card image)](https://assets.asana.biz/transform/3dc9eadf-9d2d-40a2-a05d-63adb32a1de7/article-collaboration-synchronous-vs-asynchronous-communication-2x?io=transform:fill,width:2560&format=webp)

![[Templates] Design Project Plan (Card image)](https://assets.asana.biz/transform/c768a28c-822f-420f-93f9-f2eea4c93780/TG23-web-thumbnail-032-bill-of-materials-static-2x?io=transform:fill,width:2560&format=webp)
Create templates with Asana
Learn how to create a customizable template in Asana. Get started today.