Social media reporting
Easily track and share your social media performance with a customizable reporting template in Asana.
Sign up to create your own template.
INTEGRATED FEATURES
Recommended apps

A great campaign can fall flat without well-organized reporting. If you’re scrambling to collect data, make sense of performance, or keep leadership informed, it’s a sign your social media reporting process needs structure. Whether you’re measuring Instagram stories or TikTok campaigns, creating a reliable, easy-to-use social media reporting template can save hours each week and turn your insights into action.
This social media reporting template simplifies everything. With built-in dashboards, structured task tracking, and integrations with tools like Google Analytics and Canva, you can monitor engagement metrics, track content performance, and produce consistent reports that align with your marketing goals.
Who benefits from social media reporting templates?
At Asana, our in-house marketing team uses these custom reporting templates to consolidate social media metrics from dozens of campaigns and initiatives. It helps us see what’s working, pivot faster, and communicate results clearly, without having to hunt through spreadsheets.
We built this social media reporting template for:
Social media managers who need to track engagement metrics, follower growth, and click-through rates across multiple platforms.
Digital marketing teams looking for a repeatable workflow to report on campaign performance, track key performance indicators (KPIs), and visualize results.
Agencies and freelancers managing reports for multiple clients, each with different business goals, target audiences, and social media strategies.
Influencers who require straightforward performance reports on their social media efforts.
Content strategists analyzing which social media posts are performing best and why.
Executives and stakeholders who want real-time data visualization, without needing to dig into social media campaign reports themselves.
Why use Asana’s social media reporting template?
We’ve seen marketing teams reduce reporting time by over 50% after switching from static documents to Asana. With dynamic dashboards and task automation, they get a single source of truth, customized for their marketing campaigns.
This social media analytics reporting template helps you optimize your reporting workflow, ensuring your marketing reports include everything from campaign performance to engagement trends. Use it to generate consistent quarterly reports, monitor conversations through social listening, and conduct a structured social media audit.
If you're tracking social media content or sharing insights with stakeholders, this template gives your team the clarity and consistency needed to move faster.
Use this free social media reporting template to:
Get real-time visibility into engagement metrics and campaign performance.
Automate monthly reports across social media channels.
Share organized and actionable insights with stakeholders.
Align your team around KPIs like audience growth, brand awareness, or conversion rate.
Customize the structure to match your marketing strategy or client needs.
How to use this social media reporting template
This section walks you through a step-by-step process for setting up and using your social media reporting template. You’ll learn how to set goals, track key metrics, visualize results, and share insights with your team.
To explore additional resources for marketing, reporting, and content planning, visit Asana’s complete template library.
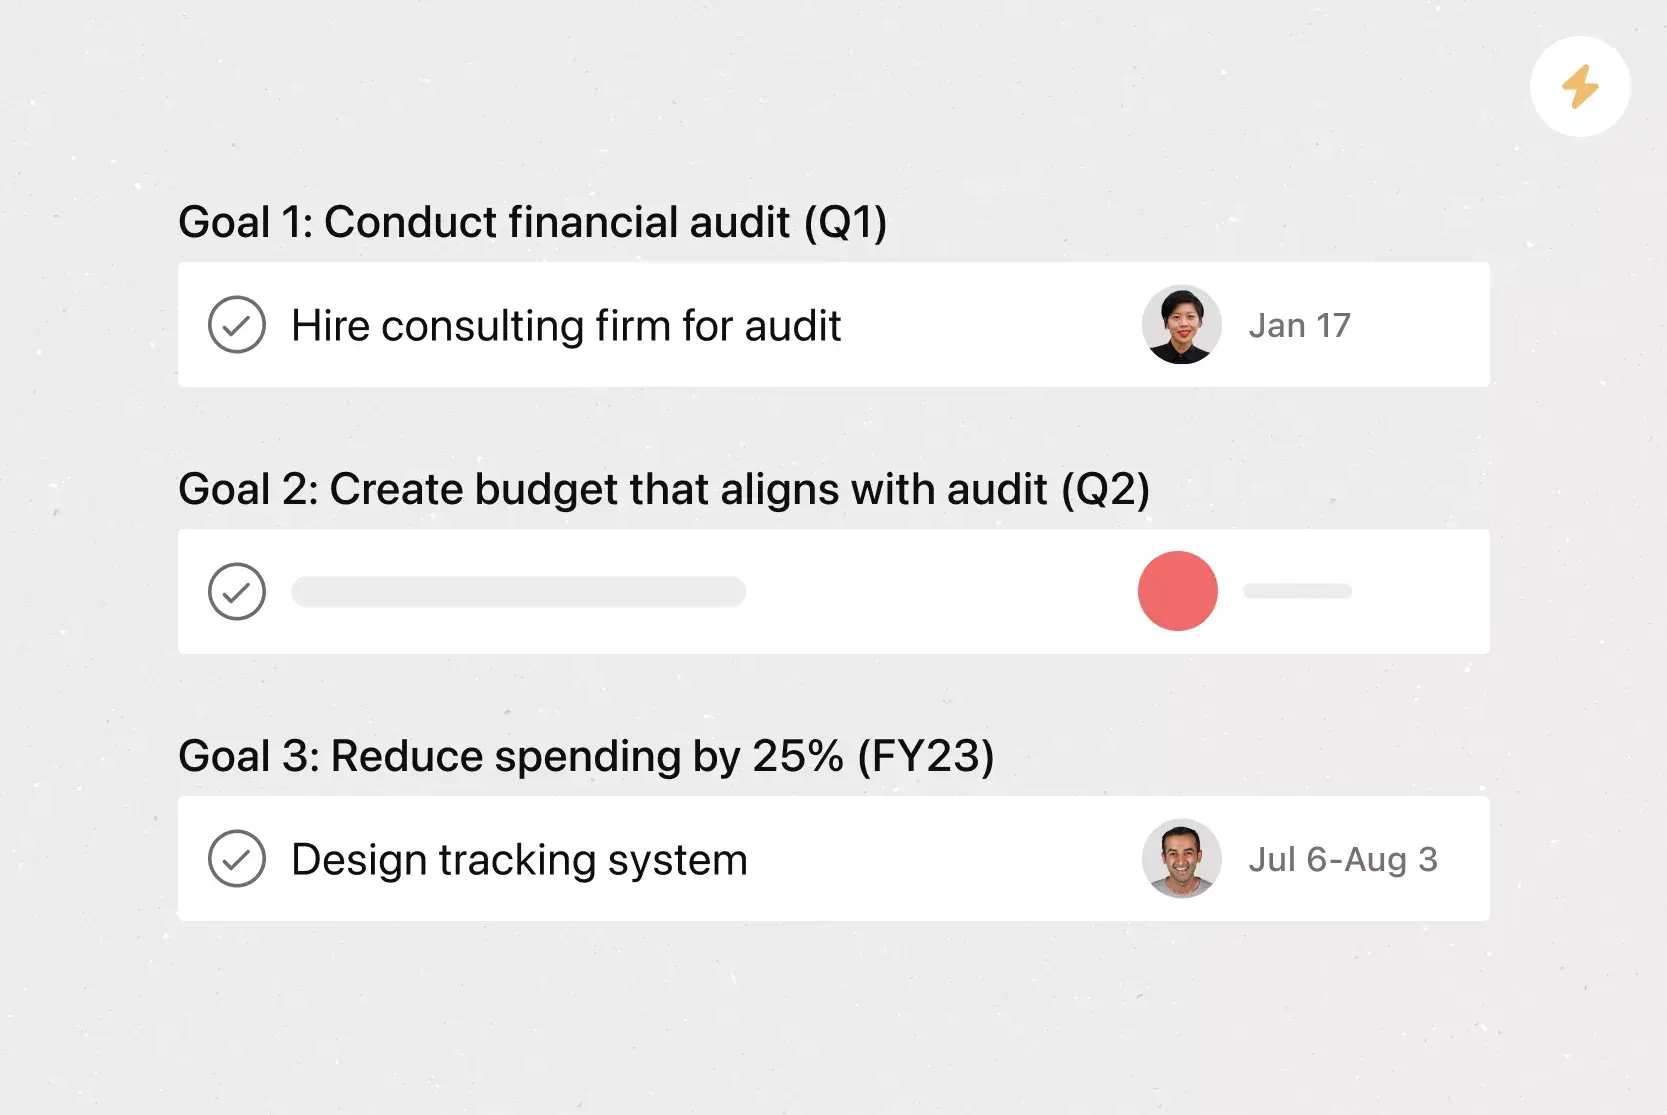
1. Set goals and reporting cadence
Start by defining your campaign objectives. Are you aiming to grow followers, boost engagement, or drive traffic to your website? Next, decide how often you'll generate reports: weekly for agile teams, monthly for performance trends, or quarterly for high-level summaries.
Example: A B2B marketing team sets a goal to increase LinkedIn engagement by 15% over Q3 and chooses to report monthly using this cadence.
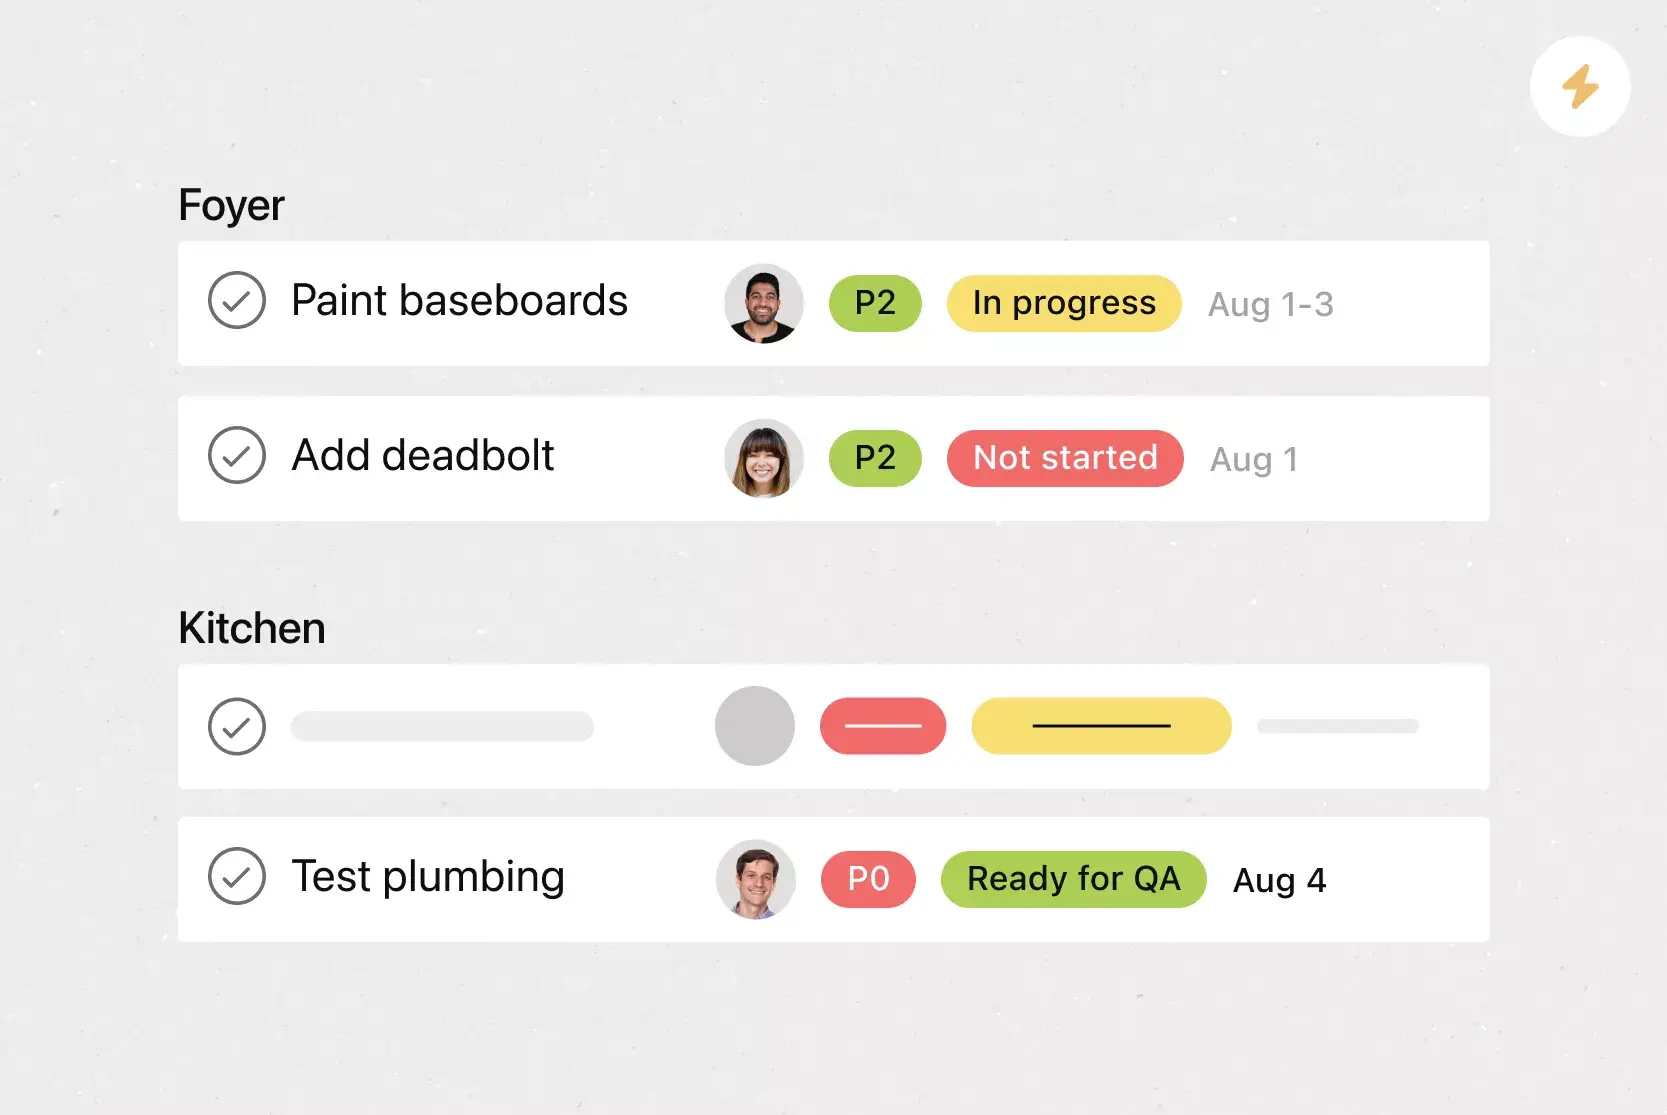
2. Track the right metrics
Use Asana’s custom fields to choose and track metrics that matter to your team and stakeholders. These can include engagement rate, impressions, reach, follower growth, click-through rate, and post saves. Align your data to your KPIs and tag top-performing posts for deeper analysis.
Example: A retail brand tracks CTR for each Instagram story to identify which formats drive the most clicks to product pages.
3. Centralize campaign data
Gather data, screenshots, platform exports, and notes in one place. Create project sections for each social media platform or campaign type. Add links to Google Sheets, embed Canva graphics, or upload performance exports directly to tasks.
Example: A social agency groups tasks under "Client X – TikTok Campaign" and attaches weekly performance summaries and visuals to each task.
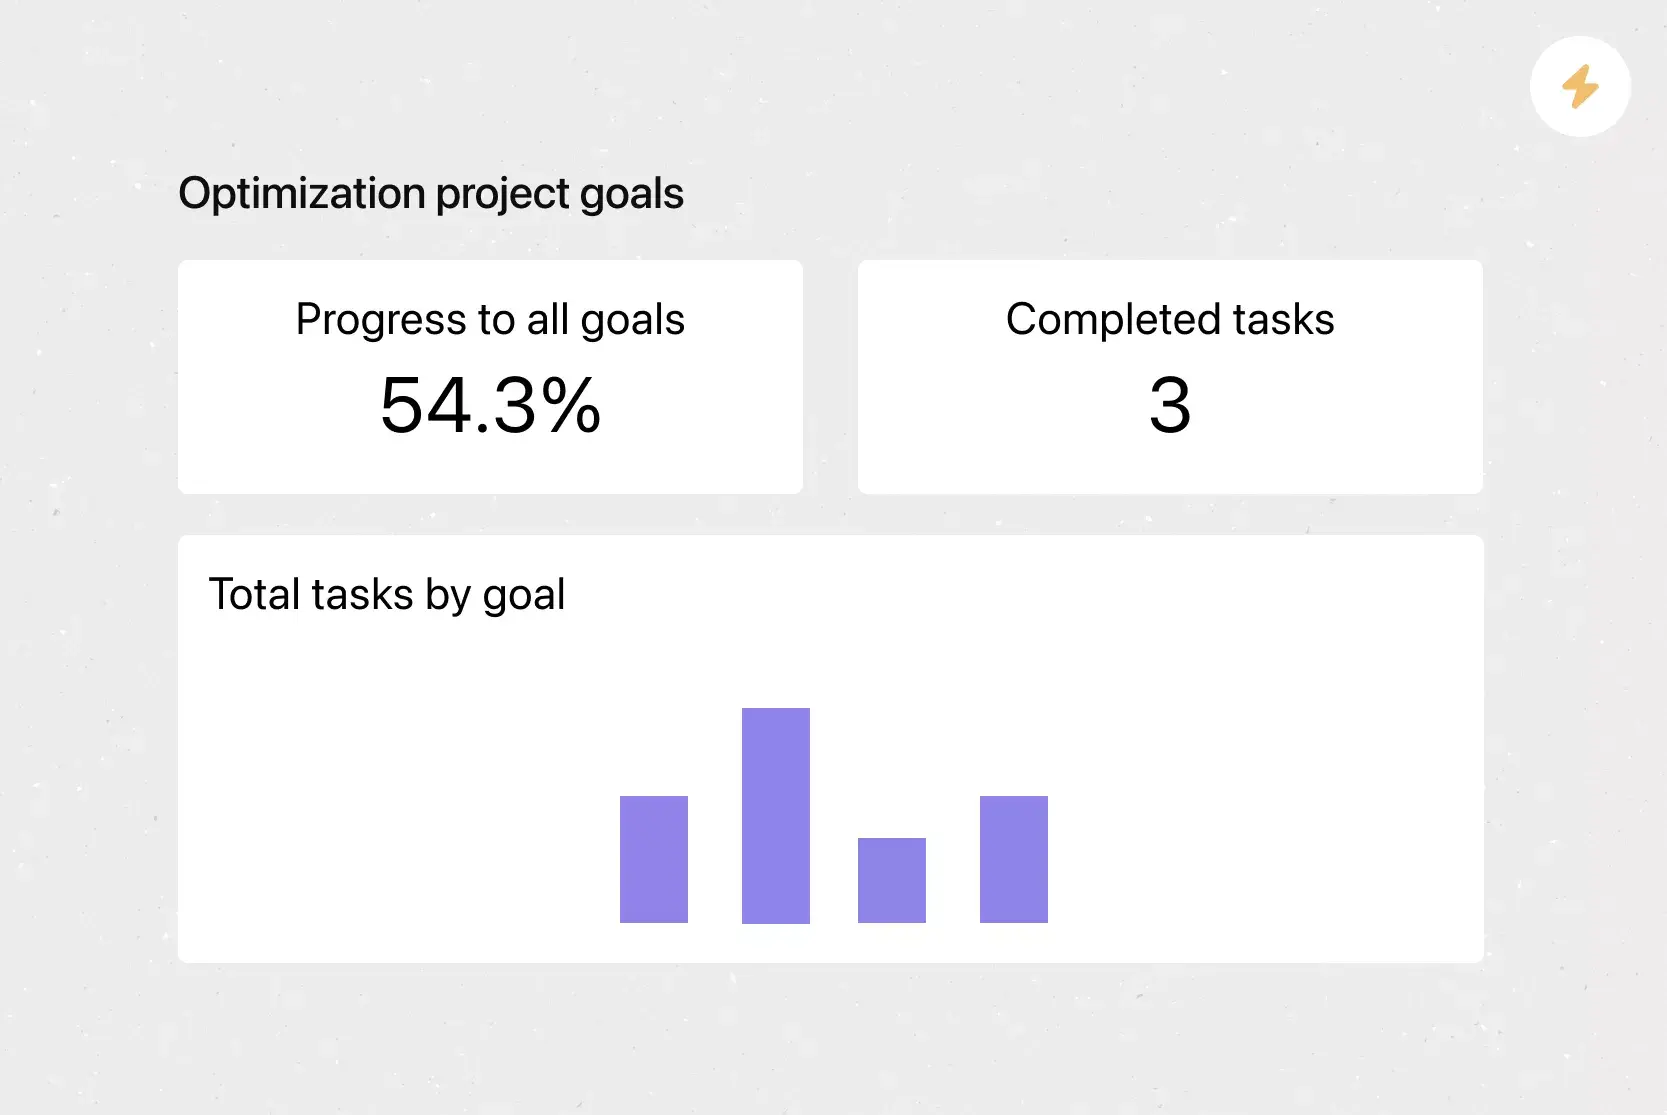
4. Visualize your performance
Turn metrics into insights using Asana dashboards. Use bar charts or line graphs to highlight trends over time, compare channels, and track progress toward goals. You can also customize views for internal teams or client presentations.
Example: A marketing director uses a dashboard widget to show month-over-month changes in audience growth across TikTok and Instagram.
5. Share with stakeholders
Keep leadership and collaborators informed without extra effort. Schedule recurring report updates and use rules to automate task status changes. Use Asana’s "Status" tab to publish summaries, link visuals, and highlight wins or blockers.
Example: Every first Monday, the template automatically notifies stakeholders and updates the "Q3 Campaign Performance" task with the latest insights.
Asana performance reporting features
We powered Asana’s reporting template with intuitive features that turn scattered data into structured insights. These tools let you automate updates, standardize tracking, and collaborate without switching tools. Each one helps you focus more on improving social media performance and less on formatting spreadsheets.
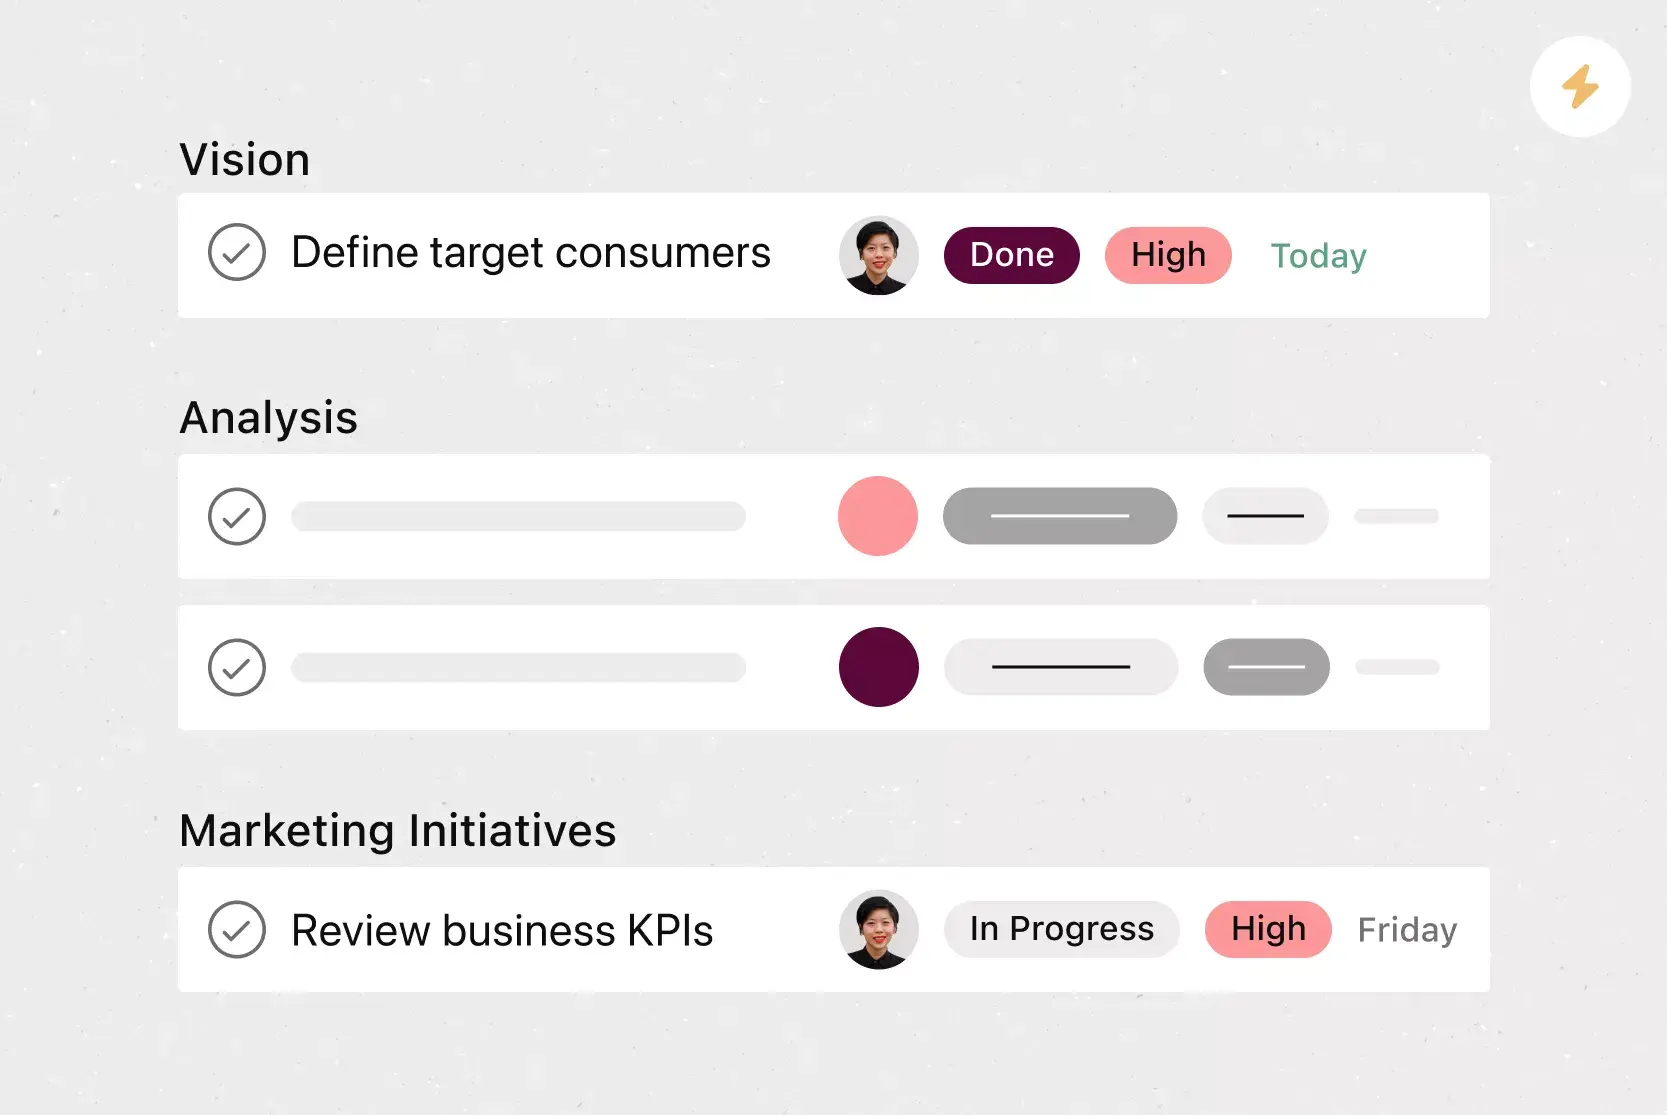
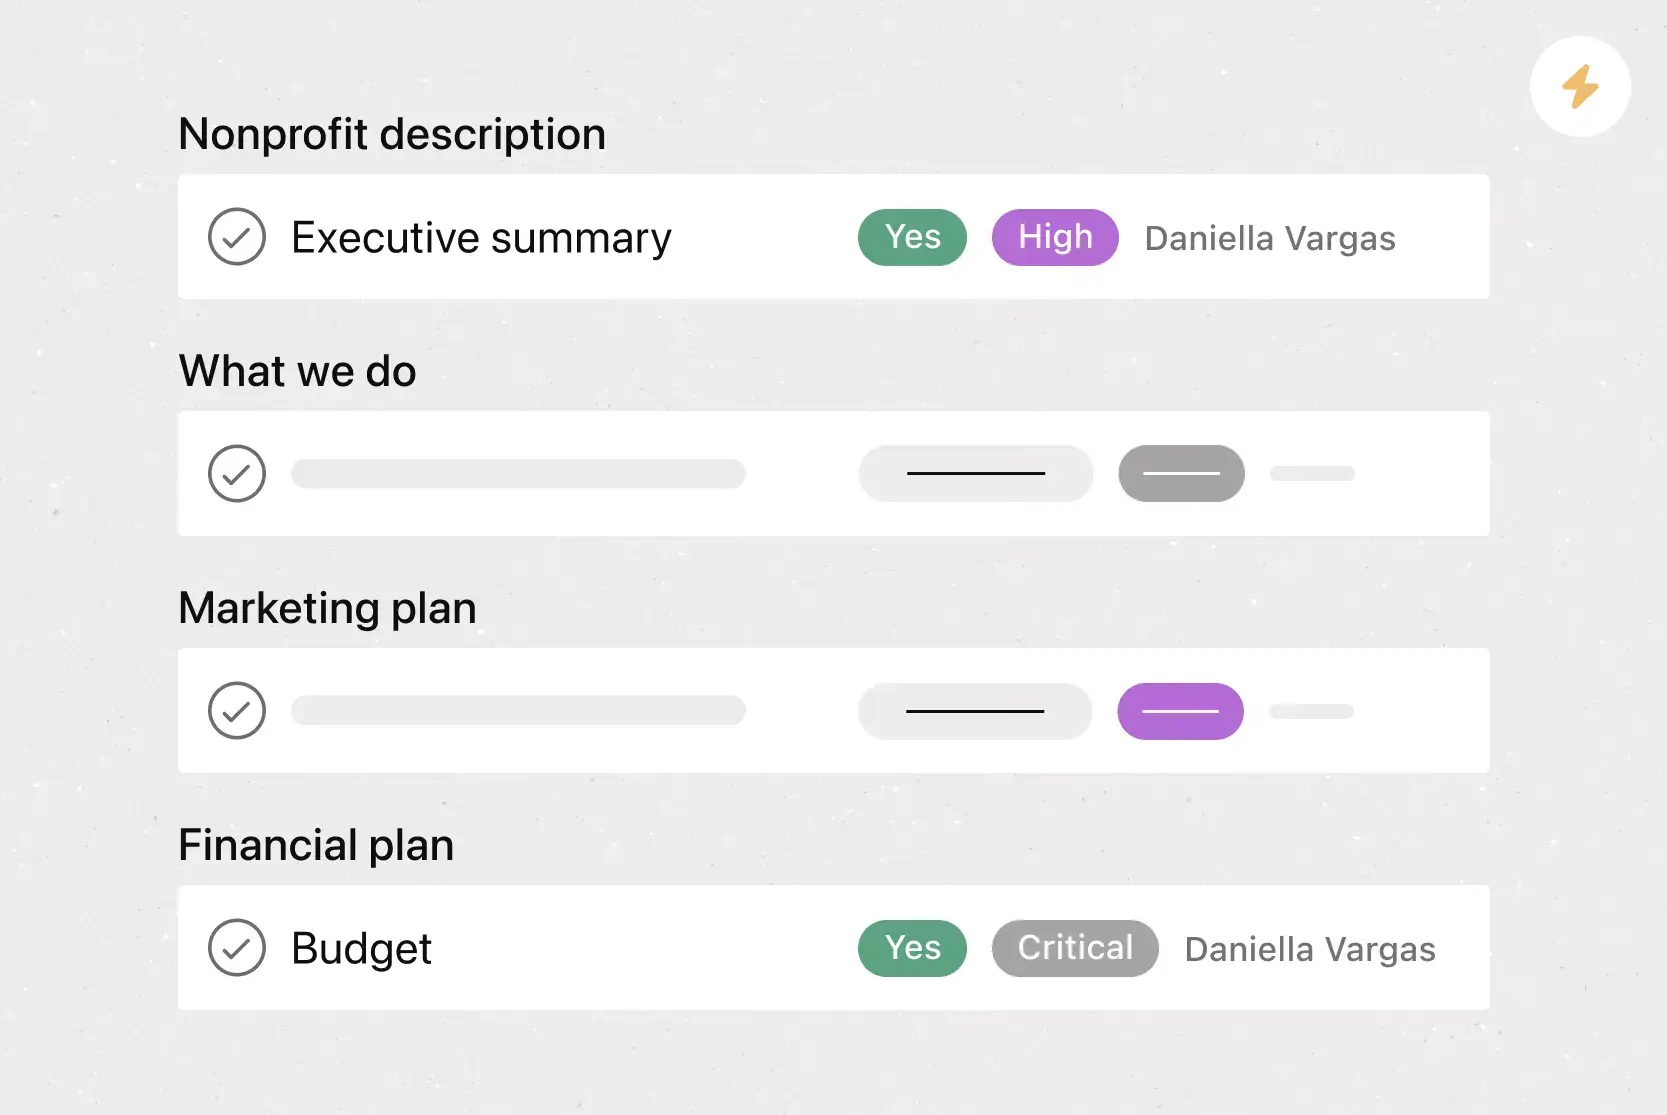
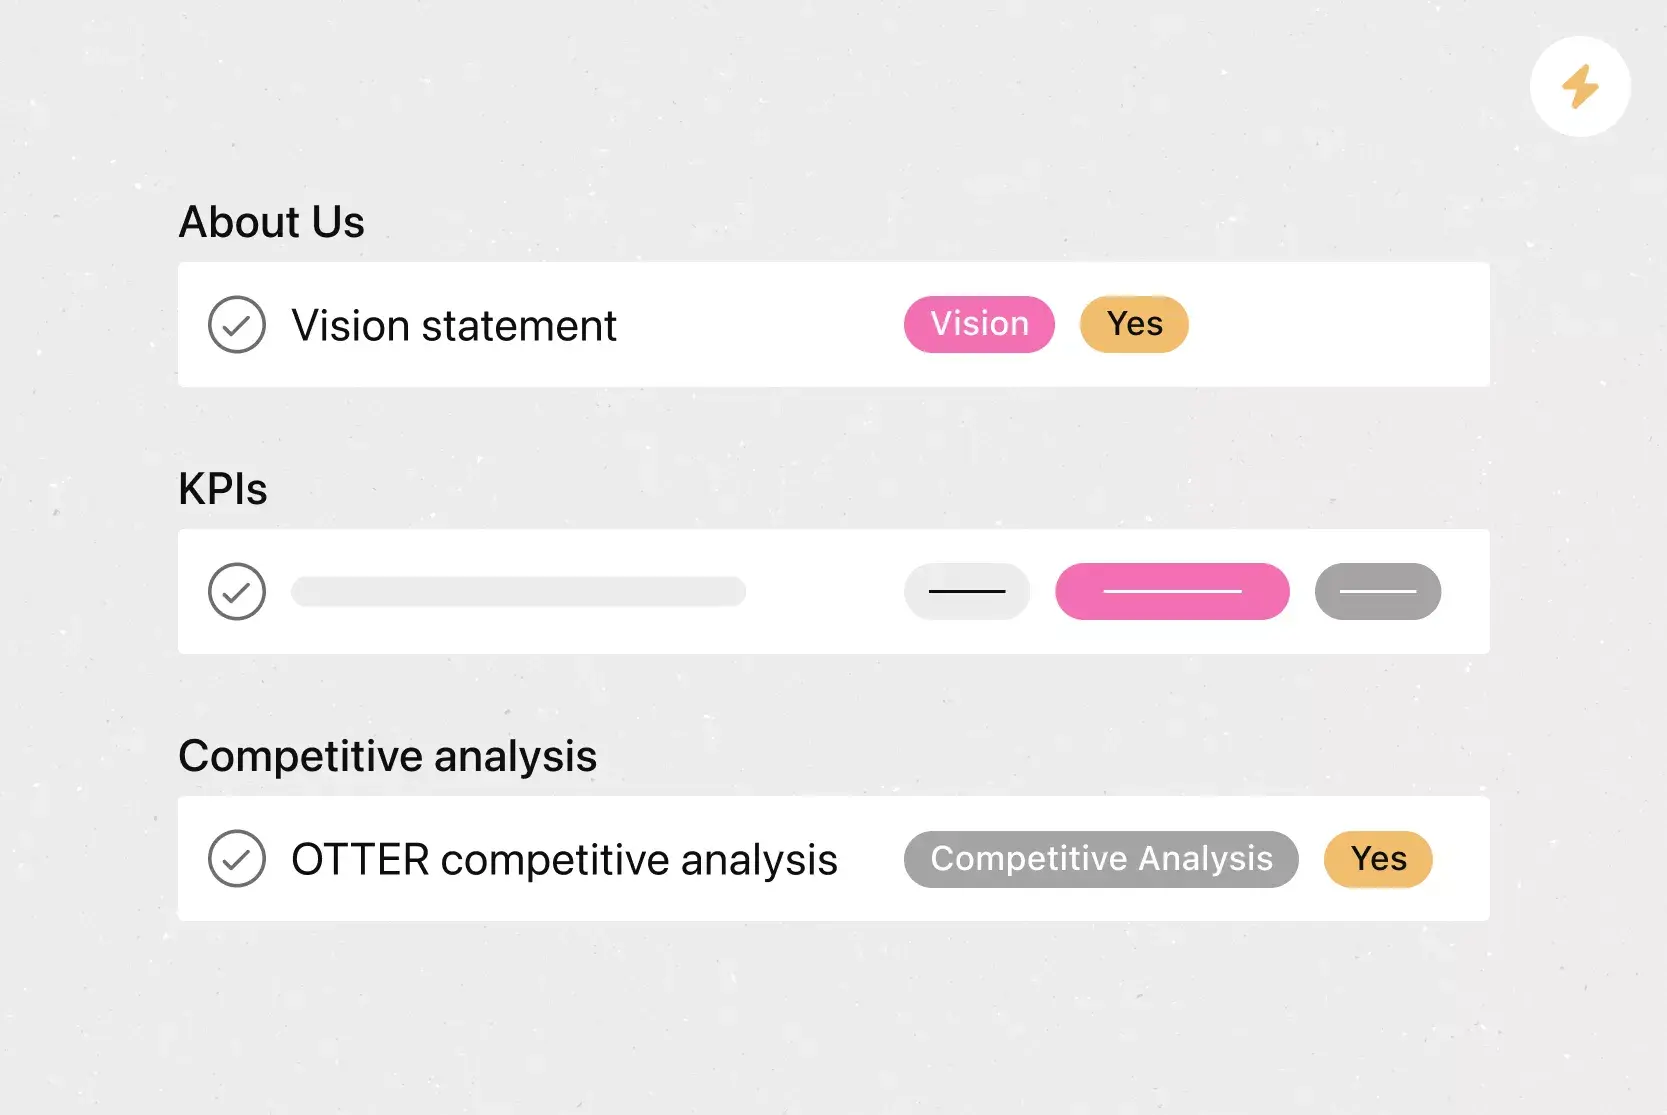
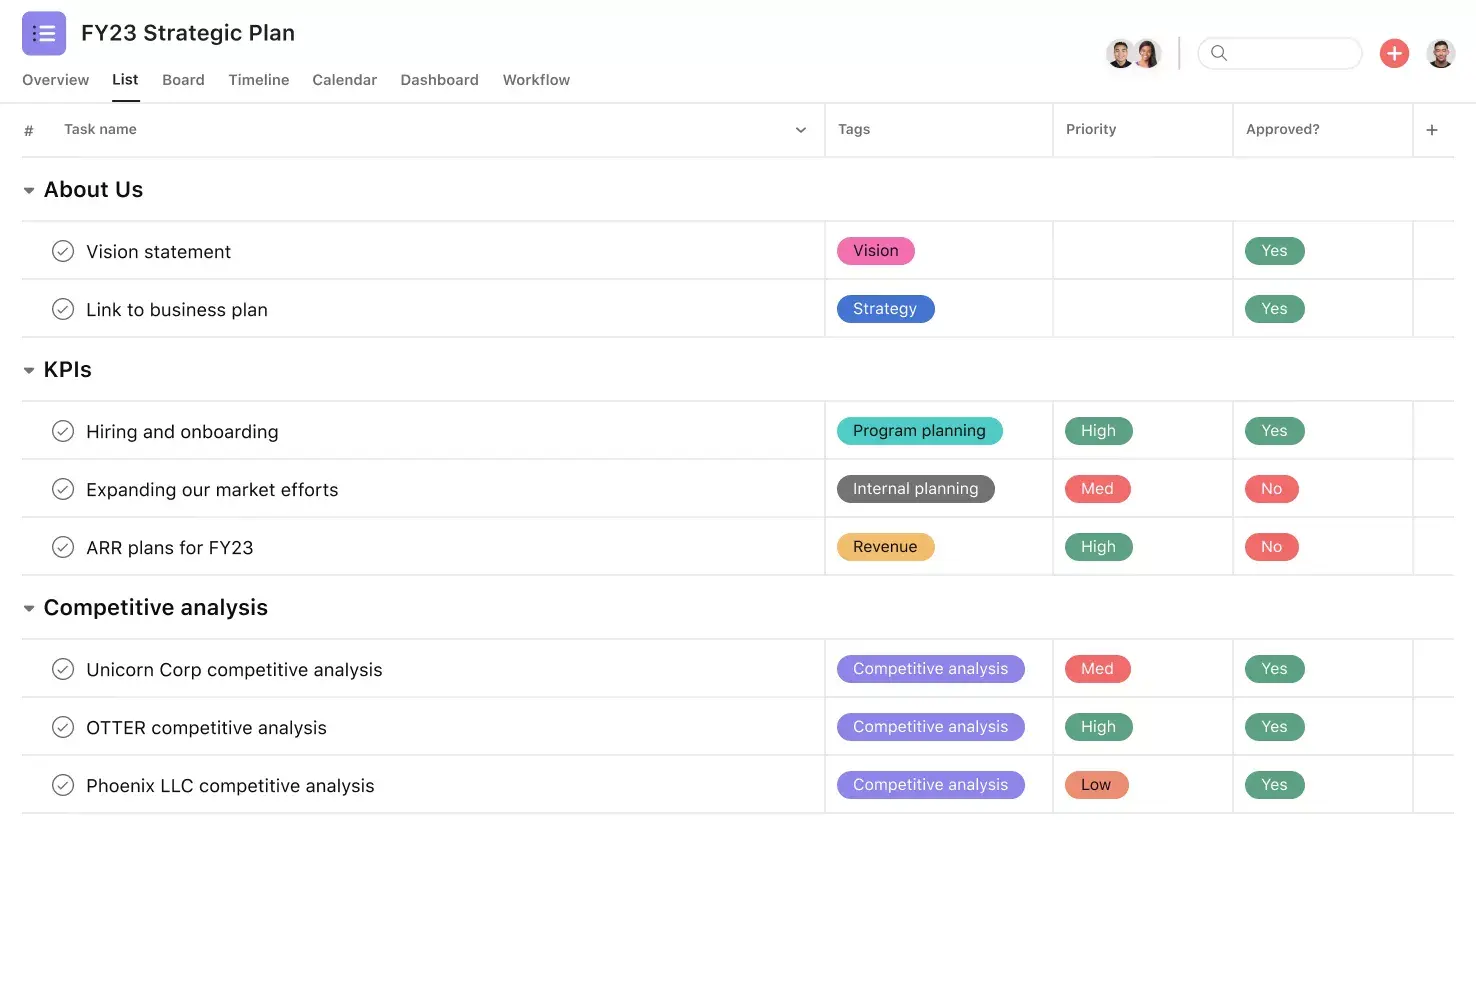
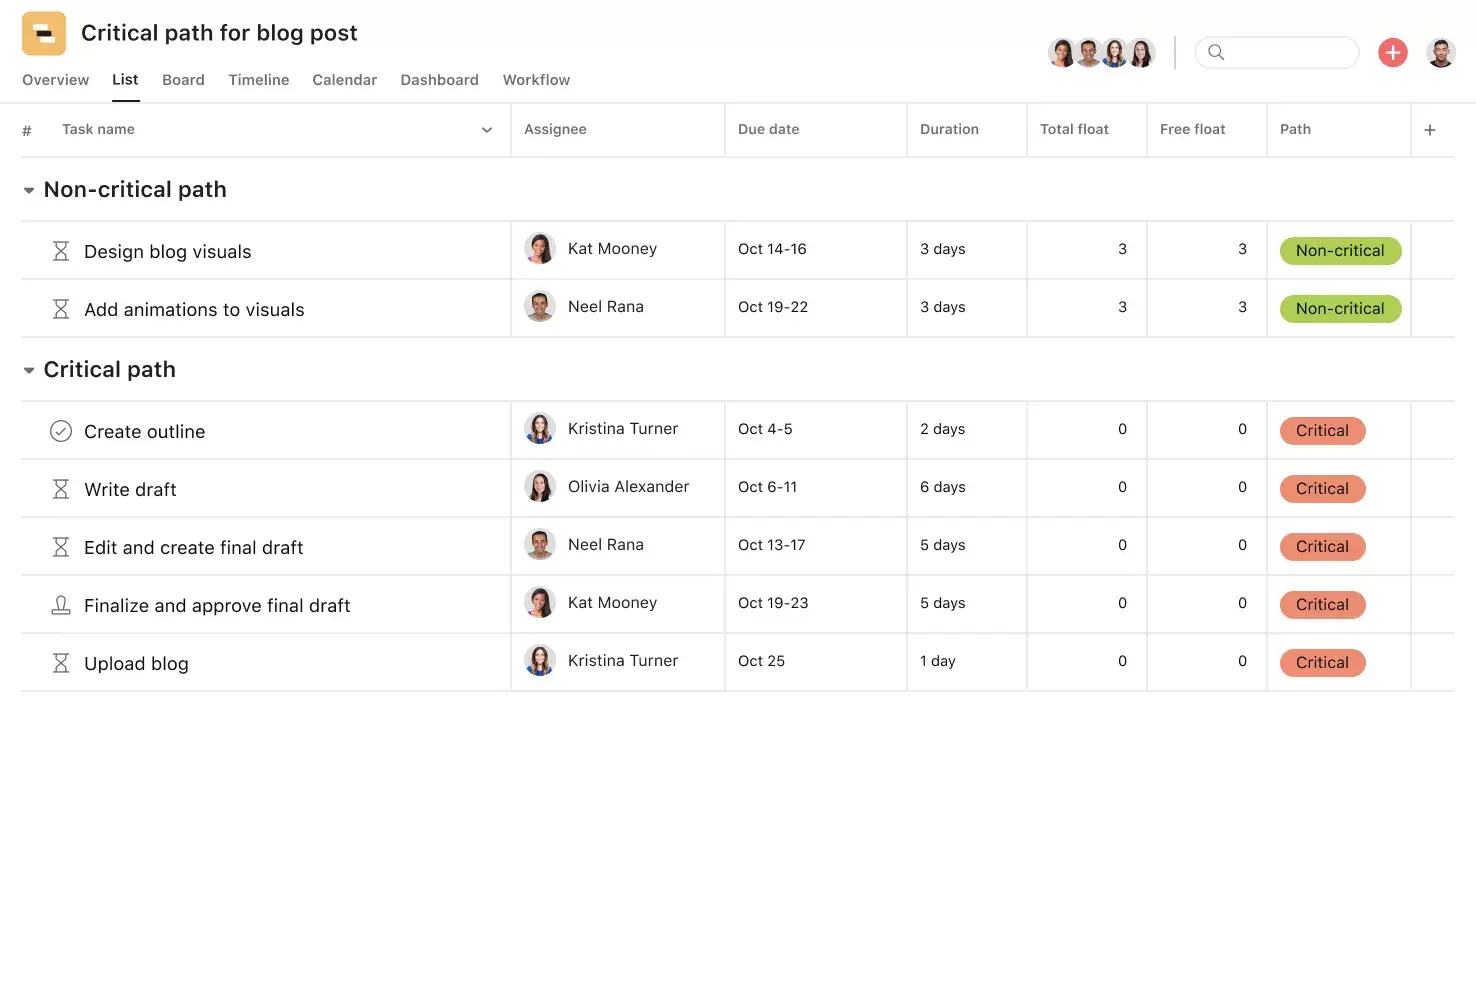
Track the exact performance metrics your team cares about by adding editable fields to tasks and projects. Use text, numbers, or dropdowns to log KPIs like click-through rate, impressions, or engagement rate. Custom fields make it easy to sort, filter, and review social media data across multiple campaigns.
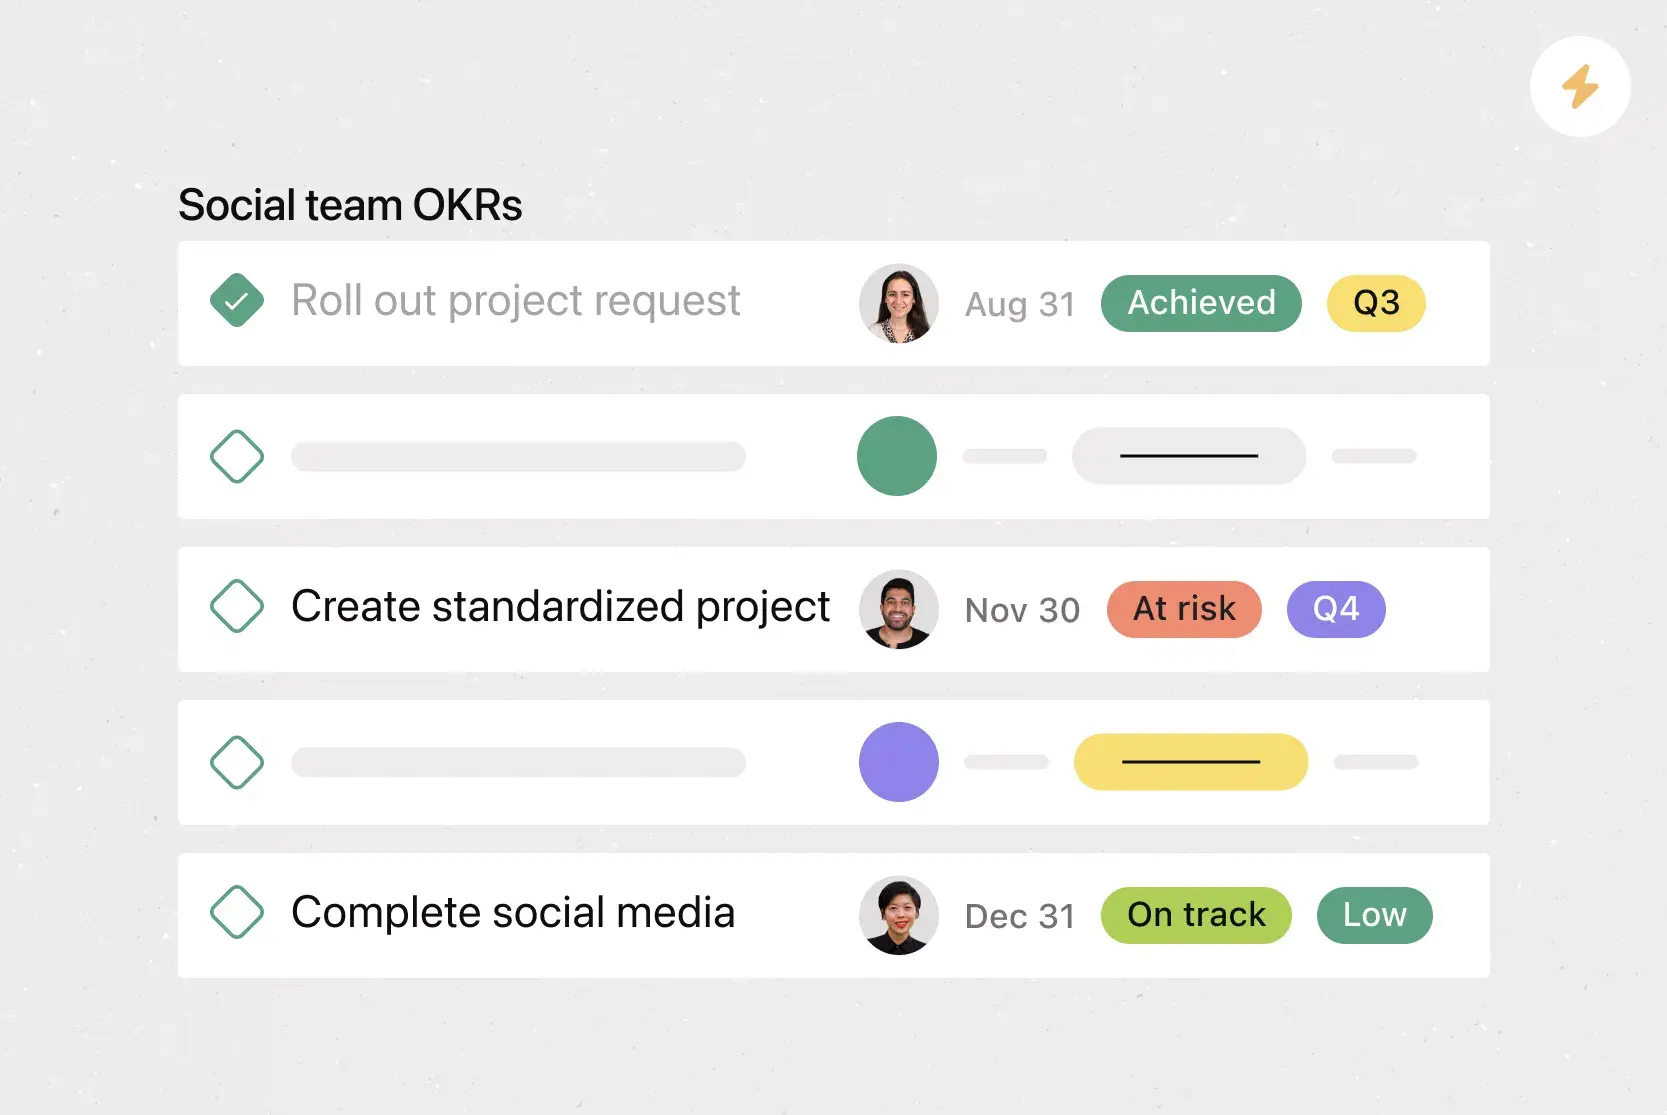
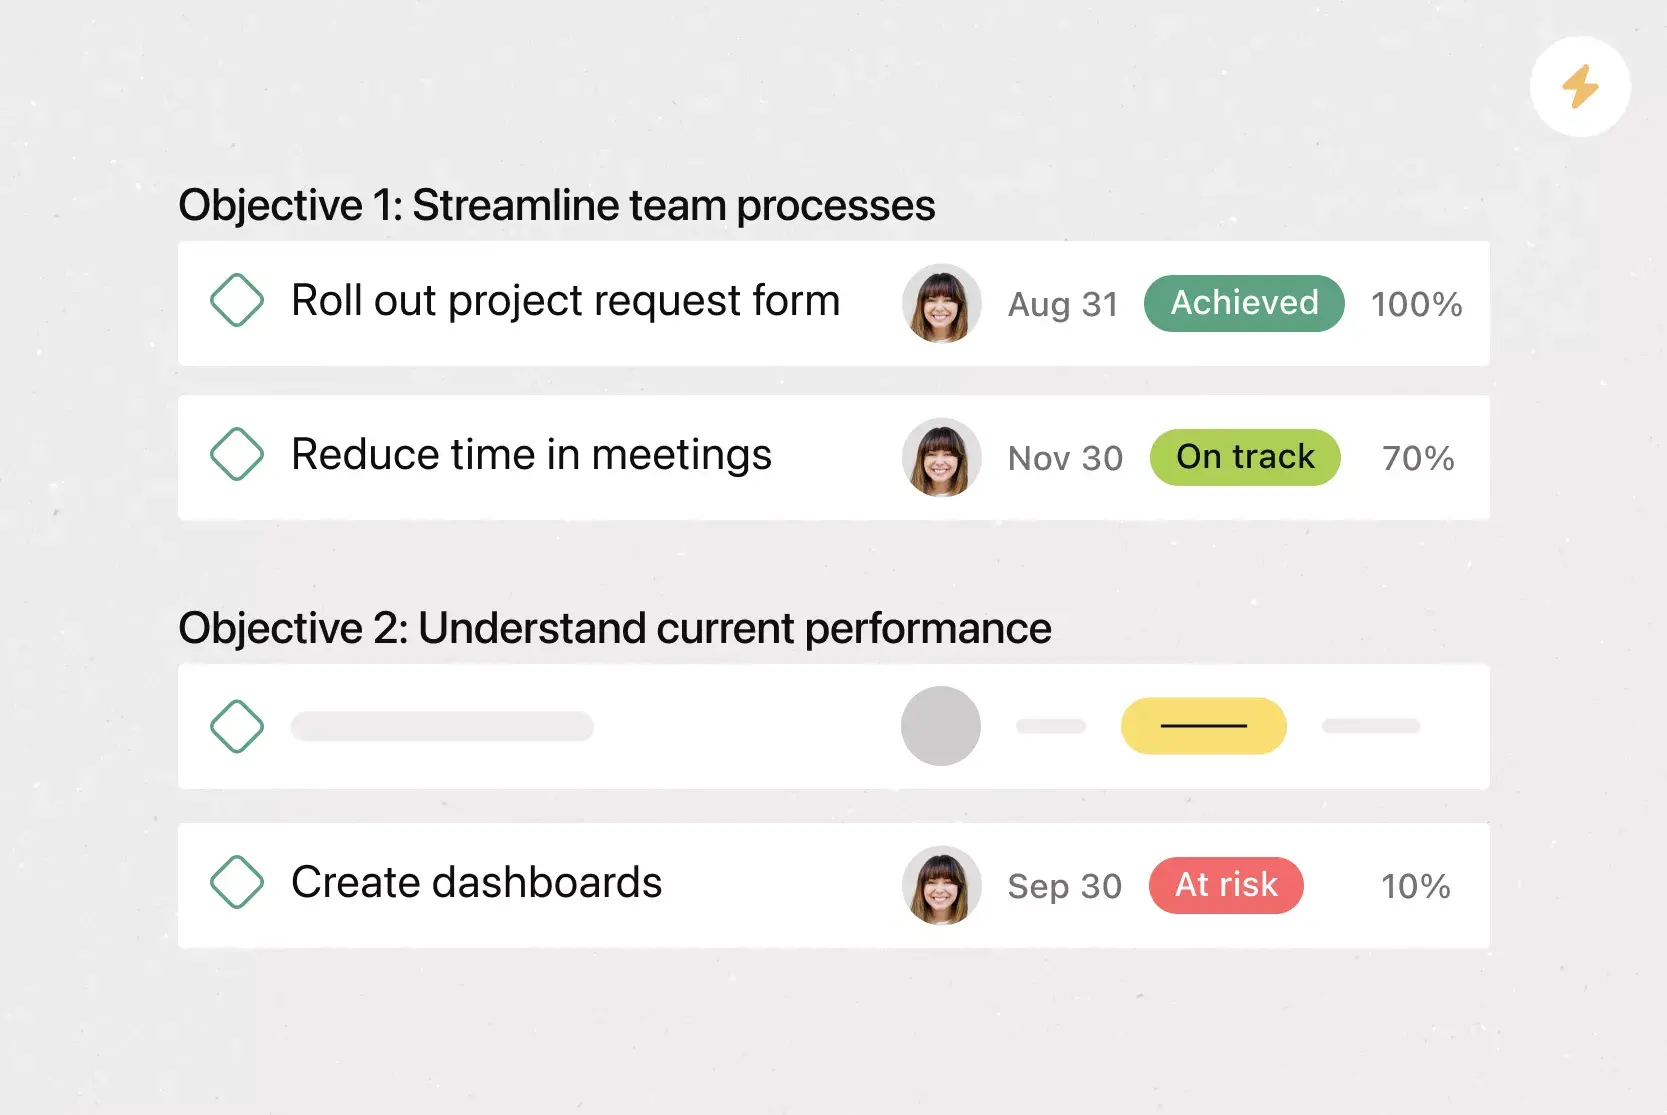
Dashboards give you visual summaries of campaign progress, top-performing content, and engagement trends. Add widgets to track real-time performance data without needing to open another analytics tool. These dashboards help teams monitor impact at a glance and make smarter, faster decisions. Customize views by audience, campaign, or platform.
Forms make it easy to collect campaign updates and performance summaries from team members. You can standardize inputs, like impressions, reach, or learnings, so your data stays consistent across teams and reporting cycles. Responses automatically populate into Asana tasks, which reduces manual work and saves time.
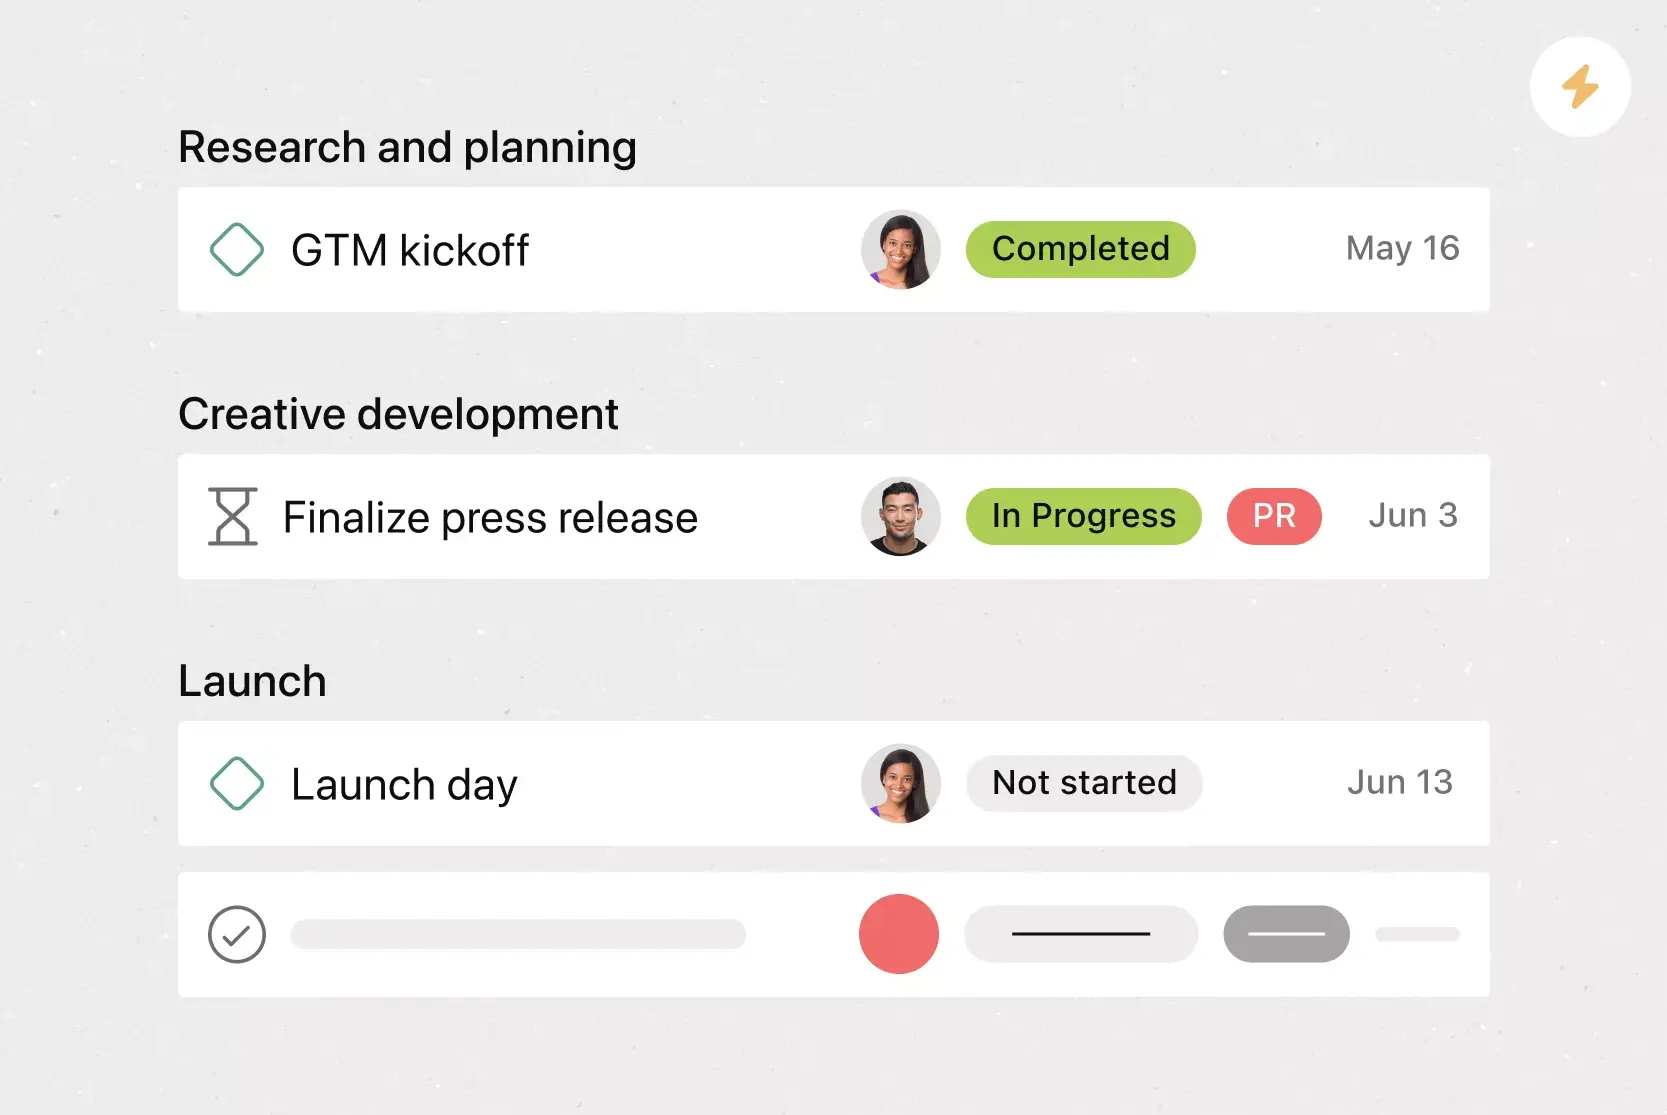
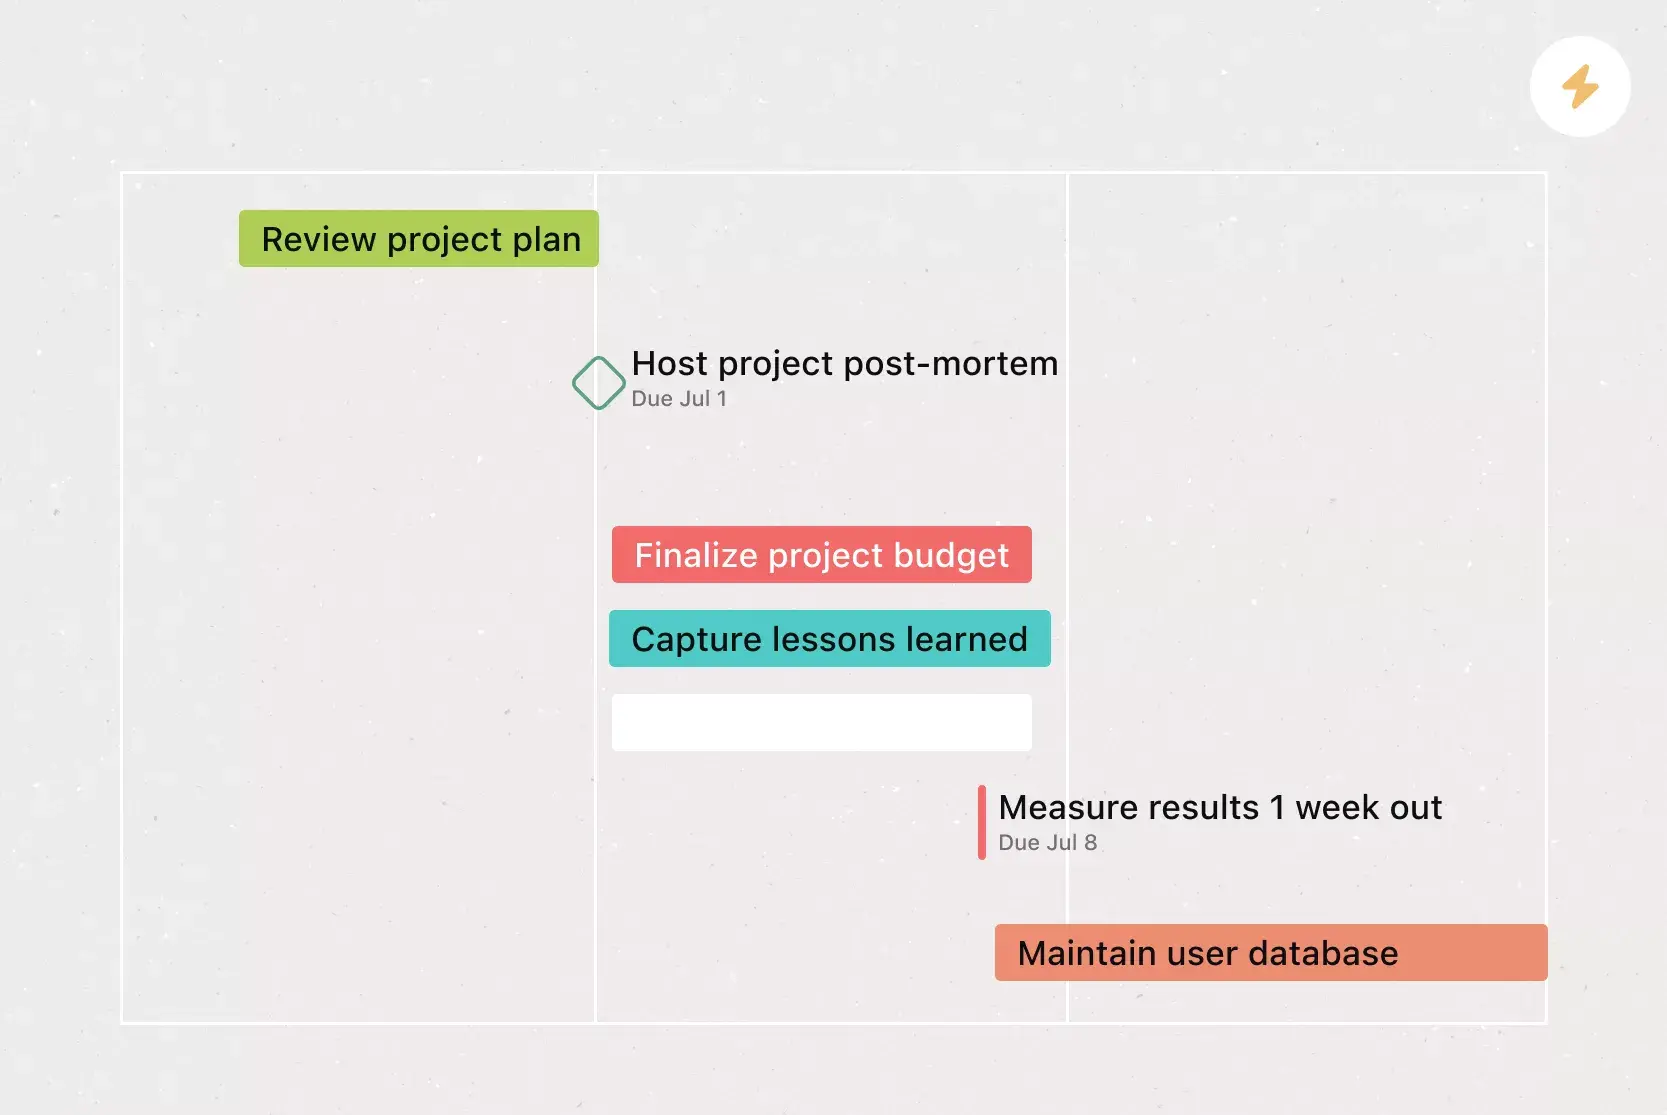
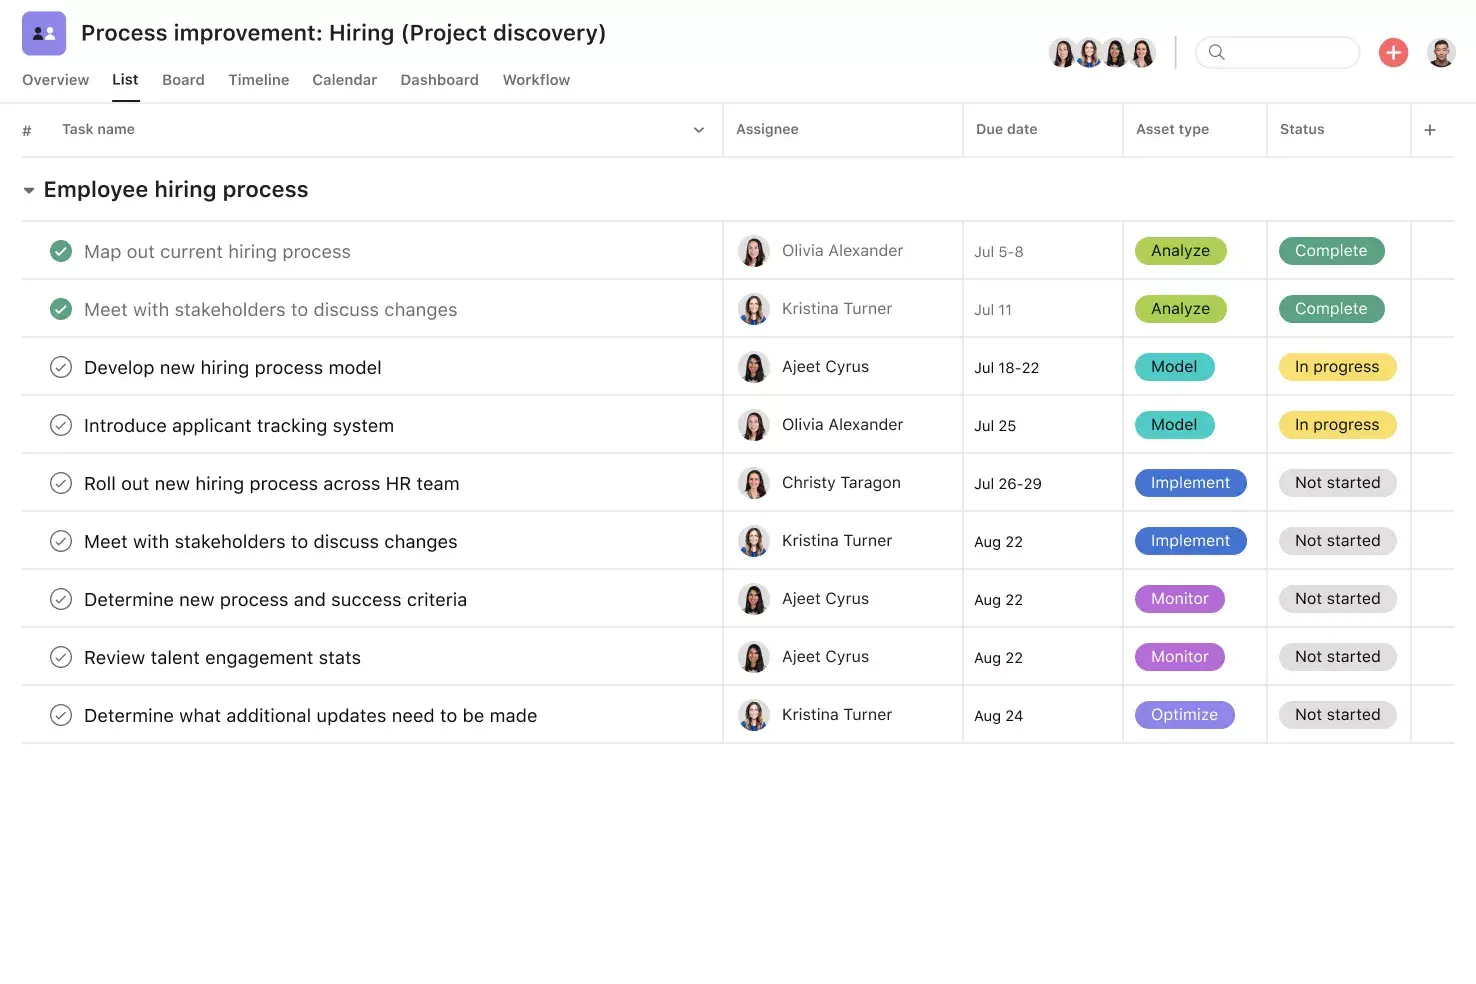
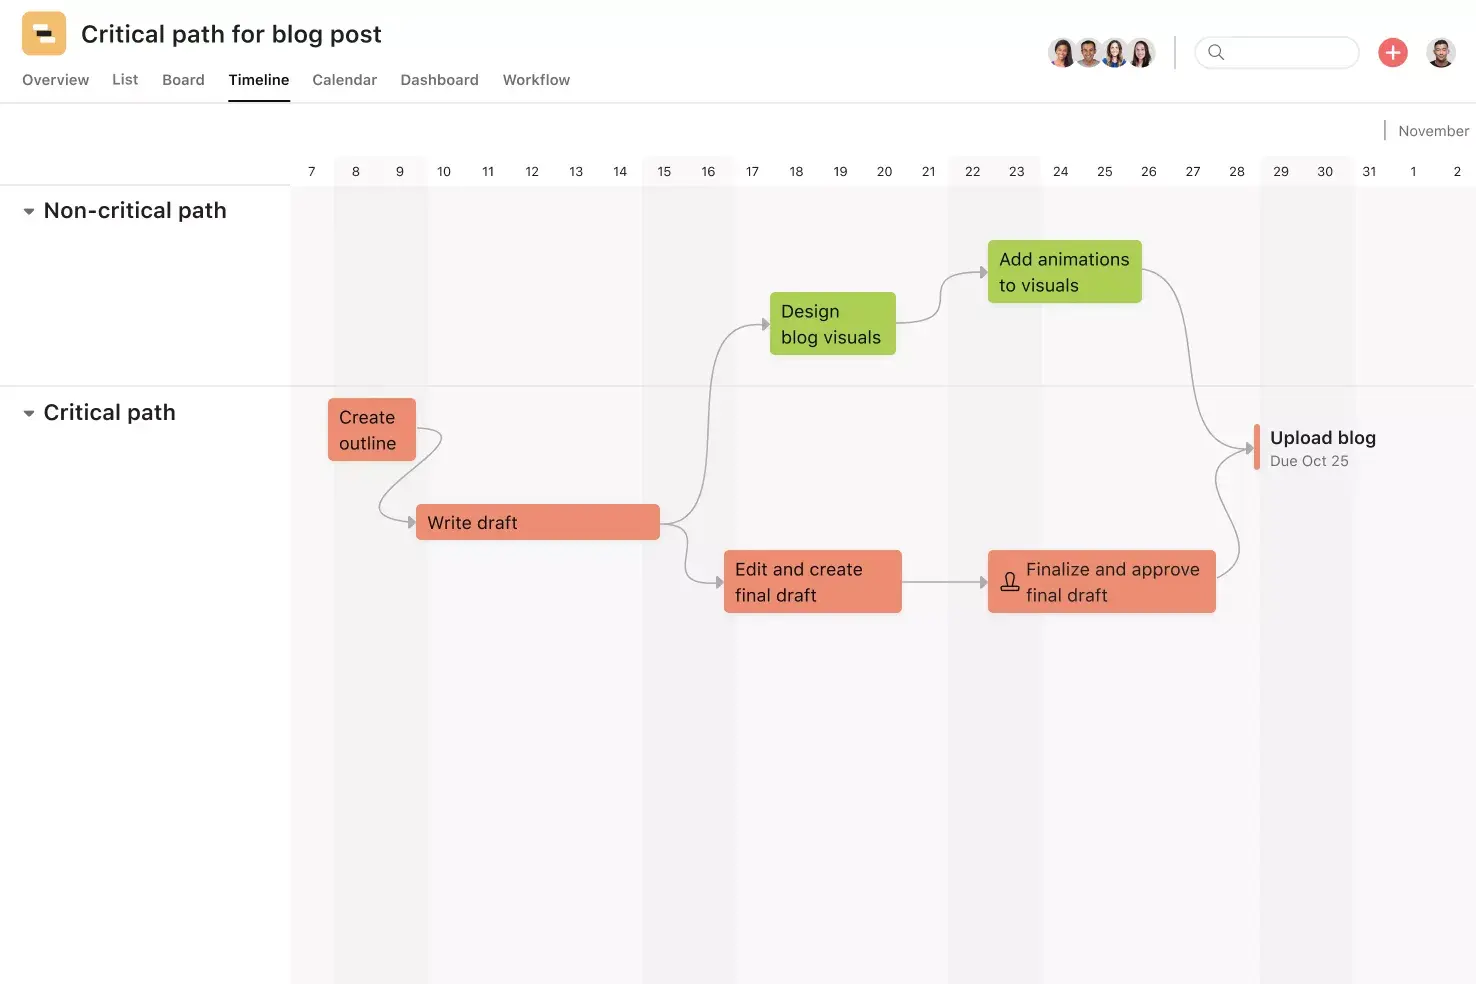
This Gantt-style layout helps you see when campaigns launched, overlap, or are scheduled to go live. Visualizing timelines across social platforms can uncover missed opportunities and reduce scheduling conflicts.
Automate routine actions like tagging a task when new metrics are added, updating stakeholders every Friday, or moving tasks when goals are met. Automations help reduce repetitive work, keep projects moving forward, and ensure team members complete updates on time.
Recommended integrations
Connect your social media reporting to the tools your team already uses. These integrations help you visualize performance, sync data sources, and streamline how updates flow into your workspace. With the right apps connected, you can build custom reports without needing to toggle between tabs.
Import Google Analytics or other data sources directly into your Asana tasks to show how social media contributes to business outcomes. You can align campaign success with bounce rates, time on page, or goal completions without leaving your workspace. This helps you tell a complete performance story in one place.
Easily attach branded visuals, infographics, or performance graphics to your reporting tasks using the Canva integration. Asana supports live previews, so stakeholders can see visual assets without downloading them.
Push key updates or performance milestones to Slack channels to keep everyone informed. Automate alerts when team members complete tasks, update KPIs, or post new social media data. The integration reduces silos between social teams and the rest of the organization.
Sync Asana projects with Google Sheets to back up data, run deeper analysis, or generate tables for external reports. You can set up two-way syncing or export data manually, depending on your needs. It's an excellent option for teams that already use Sheets for raw data tracking or pivot tables.
FAQs about social media reporting templates
What should a social media report include?
Can I customize this template for different social media platforms?
How often should I generate a social media analytics report?
Is there a free version of this social media reporting template?
How does this template help with content performance and audience growth?
Related templates

![[Templates] Product Roadmap (Card image)](https://assets.asana.biz/transform/2728edf4-eb35-4dd5-8d03-25ba8cbe5864/TG23-web-thumbnail-028-scrumban-feature-static-2x?io=transform:fill,width:2560&format=webp)


Create templates with Asana
Learn how to create a customizable template in Asana. Get started today.