What is a Gantt chart? A guide to mapping your project timelines


Key takeaways
A Gantt chart is a horizontal bar chart that maps project tasks, timelines, dependencies, milestones, and owners in a visual project schedule.
Teams use Gantt charts to plan complex projects, track progress, manage deadlines, and understand how one task delay can affect later work.
Gantt charts work best when teams use realistic dates, assign owners, add dependencies, mark milestones, and update the chart as plans change.
Traditional Gantt charts can be hard to maintain, so teams may use tools such as timelines, Kanban boards, calendars, lists, PERT charts, or AI-assisted planning, depending on the project.
Maybe you’ve heard the term "Gantt chart" used in the workplace or at a project kickoff meeting. The problem is, you’re not quite sure what that is, how it helps with project management, or how to make one.
While these charts can get quite complex, the basics aren’t hard to nail. In our guide, you’ll get a clear breakdown of what Gantt charts are, when to use them, tips for creating one, and more.
Launch high impact campaigns, faster
Get insights from marketing experts at Calendly and Asana on how to launch winning campaigns, coordinate across teams and execute faster to deliver on results, leverage AI to boost productivity, and more.
What is a Gantt chart?
A Gantt chart is a horizontal bar chart used to illustrate a project's timeline and tasks. This gives your team a visual overview of project information, including your project schedule, upcoming milestones, and overall timeline.
Each horizontal bar in the chart represents a task, and its length indicates how long that step or task will take. When you zoom out to look at the full picture, these charts give project managers and project teams an overview of what work needs to get done, who’s doing it, and when.
Gantt charts typically include the following seven components:
Tasks
Task start date
Task duration
Task end date
Timeline
Dependencies
Milestones
Most Gantt charts also provide context on how projects connect to one another and to their task owners. With a dynamic timeline, team members have at-a-glance insight into what they’re responsible for and how their work impacts the project as a whole.
History of the Gantt chart
Polish engineer Karol Adamiecki created the first iteration of a Gantt chart in 1896, which he called the harmonogram. Adamiecki published his findings in Russian and Polish, which made them difficult to access in English-speaking countries. In 1910, American mechanical engineer Henry Gantt independently popularized a similar chart in the United States, which he devised in order to represent how long factory workers spent on a given task. These two systems have since been merged to create what we know today as the modern-day Gantt chart.
After tracking factory employees’ tasks, these charts became a popular way to track project schedules. Originally, these charts were drawn on paper, so whenever the schedule changed, they had to be redrawn. Later, project managers used pieces of paper or blocks to represent task bars, allowing them to move them around as needed.
Gantt chart example
Studying this Gantt chart example is helpful for understanding how to map out a project lifecycle effectively.
![[Product ui] Gantt chart project, organized timeline view in Asana with dependencies and due dates (Timeline)](https://assets.asana.biz/transform/aa091ca9-b87c-4fb0-96ad-47453f5473df/inline-project-management-gantt-chart-basics-2-2x?io=transform:fill,width:2560&format=webp)
Initial steps: The project begins with the "Identify key stakeholders" activity, which lays the groundwork for subsequent tasks.
Planning phase and project launch: Tasks such as "Map out dependencies" are scheduled alongside "Define project goals," both due by December 15, to indicate that these tasks can occur simultaneously. The "Kick off project" action establishes a key milestone and a planning deadline.
Task management: Tasks such as "Measure performance against goals" and "Assign action items" suggest a cycle of continuous evaluation and task distribution.
Finalizing and reporting: Activities that help team members and stakeholders recognize the steps needed as the project culminates include "Prepare presentation" and "Present to leadership." The final phases of the project are represented by tasks like "Communicate results" and "Complete project," which focus on project wrap-up and outcome communication.
While every chart will look different, this example will help you grasp the fundamentals of task sequencing and time management, which are critical for any successful project.
What is a Gantt chart used for?
While you can use a timeline view for a variety of projects and programs, it’s helpful to understand what these charts are commonly used for and why:
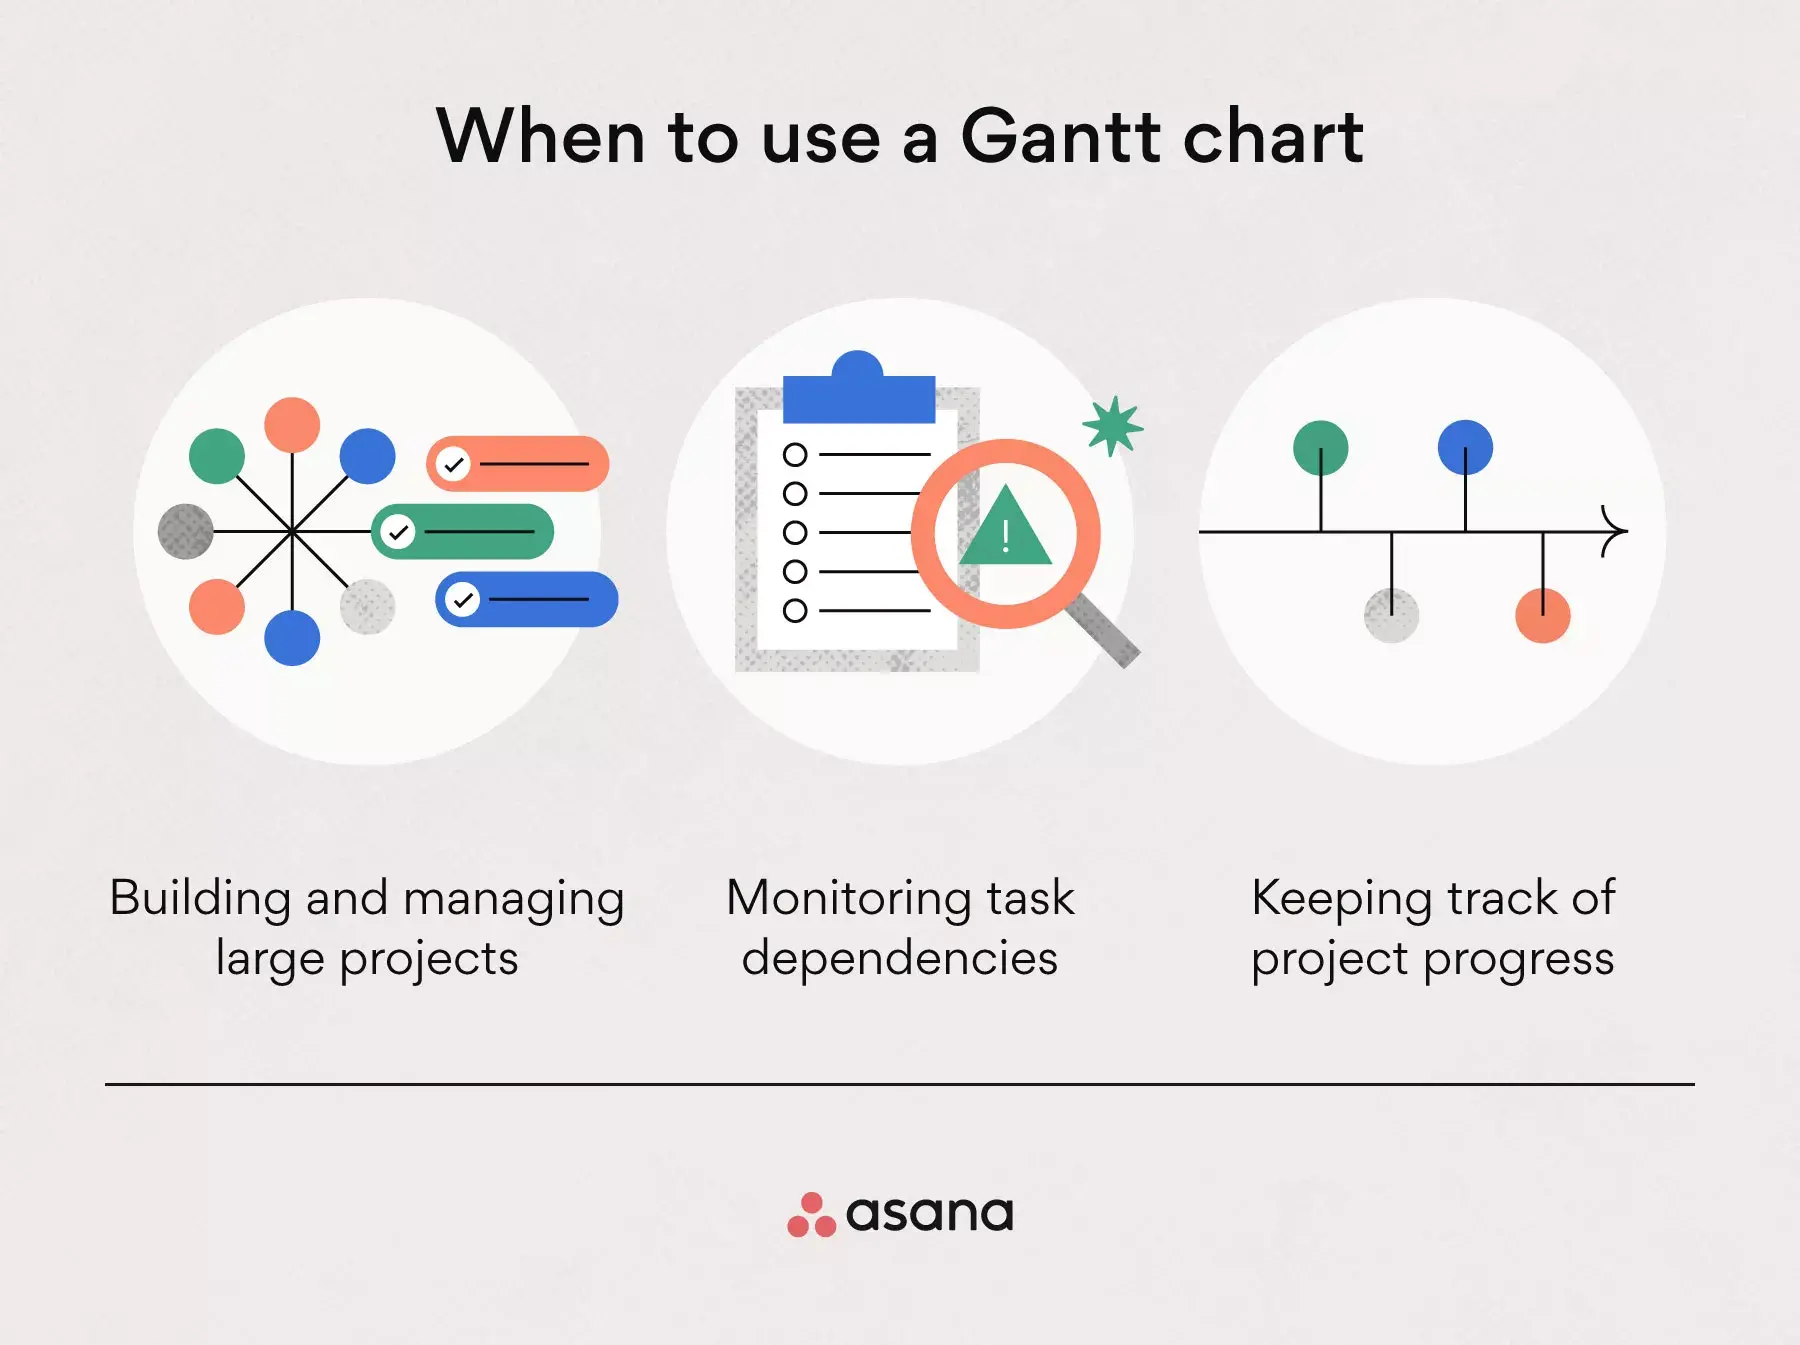
Build and manage complex projects: The bigger the project, the more tasks there are to manage. Gantt charts can help project managers schedule projects by allowing them to easily visualize the project and break it down into smaller tasks.
Monitor task dependencies: Project delays happen. Visualizing work on a timeline helps project managers automate task dependencies, ensuring that the next phase or task doesn’t start until the previous one has finished.
Keep track of project progress: Track progress and milestones, so you can quickly adjust your project plan if needed.
Ways to use a Gantt chart
The examples below show how Gantt charts help teams organize timelines, owners, and dependencies for different types of projects.
Mapping out a marketing campaign
Larger marketing campaigns require extensive team collaboration and coordination, and it’s easy to lose track of all the moving pieces. That's why it's so important to visualize all your work as a sequence of tasks, with assignees and the time each initiative will take. This way, teams don’t just know who’s responsible for what, but also how their work impacts others or the larger goal.
Outlining deliverables for a client
When you show clients a timeline of all of your deliverables, you can clearly set expectations around how long each will take. By outlining plans this way, you can give stakeholders and clients a clear idea of the scope of your deliverables and how long each one will take to accomplish, so they won’t just know when you’re delivering an item, but also the timeframe in which you’ll be working on it.
Planning a product launch
For product launches, you might use a timeline to map out the entire plan, from ideation to launch and beyond. By visualizing this on a timeline, you can more easily spot conflicts before you begin, see dependencies between steps, and get a clear overview of everything happening leading up to and during the launch.
Who should use Gantt charts?
Gantt charts are useful for anyone who needs to plan work on a timeline, monitor deadlines, or coordinate tasks between people and teams. They’re especially helpful for projects with multiple phases, workflows, dependencies, or approval steps.
Who should use Gantt charts? | How they use them |
Project managers | Plan project timelines, assign owners, track dependencies, and monitor progress. |
Team leads | Coordinate work within a department, balance deadlines, and review task status. |
Operations teams | Manage repeatable processes, plan resources, and track work that depends on cross-functional handoffs. |
Business owners | See what work needs to happen, when it’s due, and who is responsible. |
Executives | Review major project timelines, milestones, and risks without needing every task-level detail. |
Construction teams | Map out design, permitting, procurement, inspections, and build phases. |
Software teams | Plan releases, QA, bug fixes, and product launches. |
Marketing teams | Organize campaigns, content calendars, creative reviews, and launch plans. |
Event planning teams | Track vendors, venues, logistics, approvals, and day-of tasks. |
Creative production teams | Coordinate briefs, drafts, design work, feedback rounds, and final delivery. |
Parts of a Gantt chart
Have you ever wondered what makes up a Gantt chart and how each component contributes to effective project management? Understanding the anatomy of a Gantt chart can help you leverage its full potential in organizing and visualizing your project timelines. Here are the essential components of a Gantt chart, each with an example:
Task list: A vertical list of project tasks on the left side of the chart, serving as the foundation for plotting the project timeline. For example, a project to develop a new website might include tasks like "design homepage," "write content," and "code website."
Task bars: Horizontal Gantt bars that represent the duration of each task, showing the start and end dates. For instance, the task bar for "design homepage" might span two weeks in April, visually indicating its planned duration.
Milestones: Markers that signify key dates or achievements within the project timeline. An example is marking the completion of the website prototype as a milestone, which indicates a significant achievement in the project's progress.
Dependencies: Lines or arrows that connect tasks to indicate the sequence in which tasks must occur. If "write content" cannot start until "design homepage" is complete, a dependency arrow would connect these tasks.
Critical path: Highlights the longest sequence of dependent tasks that determines the project's duration. In our website project, the critical path might include tasks such as "code website," directly impacting the project's end date.
Resource allocation: Information on which resources are assigned to specific tasks is often included alongside the task bars. An example would be assigning a specific web designer to the "design homepage" task.
Dates and time scale: The top of the chart features a calendar or time scale against which tasks and milestones are plotted to provide a temporal context. For example, the entire project might be set against a six-month time scale from April to September. This helps stakeholders visualize the project timeline at a glance.
Each of these components plays an important role in providing a comprehensive overview of the project's scope, duration, and dependencies.
How to make a Gantt chart
While no two Gantt charts look exactly alike, there are some basic steps you’ll need to take to get you off the ground, no matter what project management software you use.
Create a Gantt chart template1. Define the time range
Your Gantt chart should represent a project with start and end dates. Think of this chart as a way to represent your project over a timeline; your timeline needs a beginning and an endpoint.
Tip: While all projects should have an endpoint, it’s likely that you’ll have some additional follow-up tasks with your client after crossing the finish line, so you may need to add in some dates after the fact for these items.
2. Add tasks with start and end dates
To effectively visualize your to-dos, make sure each task has a specific start and end date—this way, they can be easily shown on a bar chart. If you don’t add task start dates, your tasks will appear as moments in time, which might be harder to visualize in the bigger picture.
Tip: Clear start and end dates also make it easy for your team to understand when they should begin working on a task. By doing this, they won't be unprepared for a big project that is due tomorrow.
3. Clarify dependencies
With large projects, it’s natural to have some tasks that can’t get started until other tasks are complete. To keep the project running smoothly and every team on the same page, you can visualize dependencies between tasks in your Gantt chart.
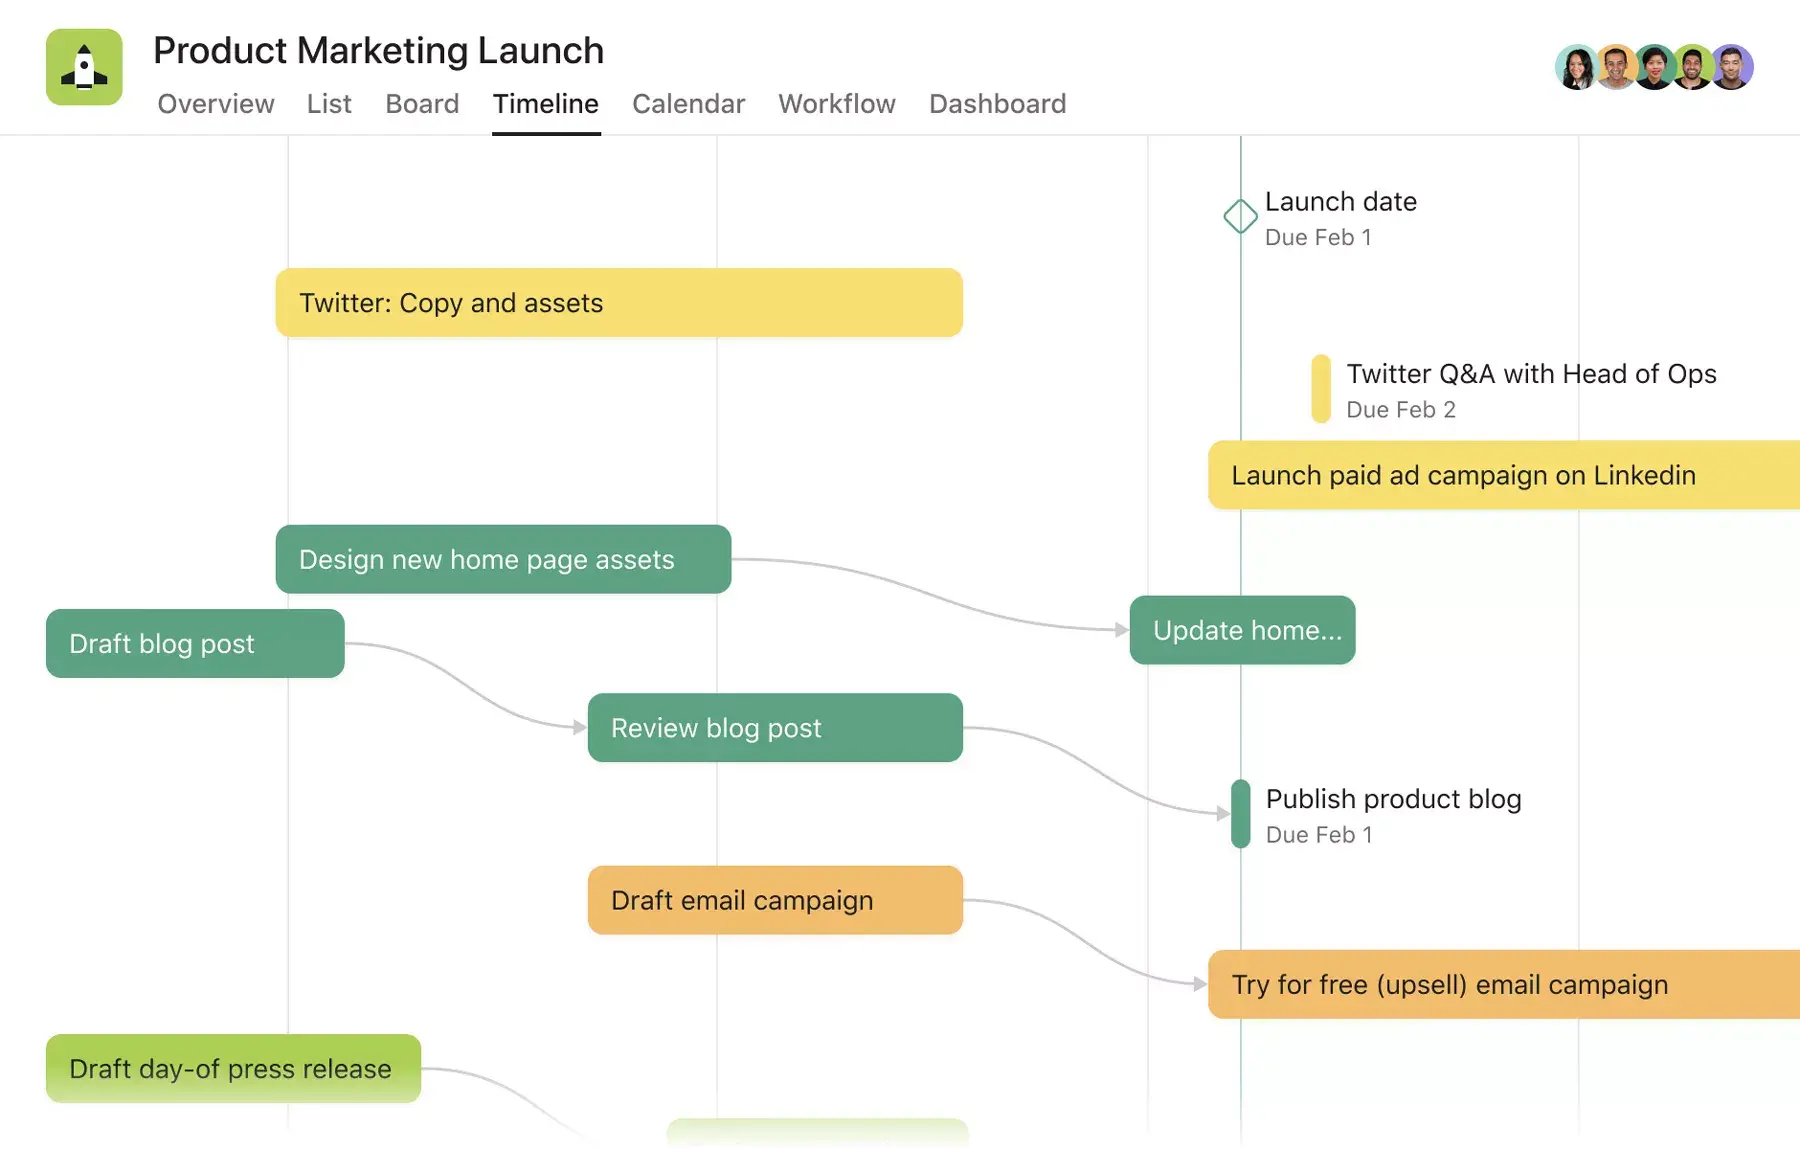
In the example below, publishing the product blog post depends on reviewing it, which in turn depends on drafting it. Similarly, the team can’t launch the email campaign until it’s been drafted. Drawing dependencies among these tasks will help the next team stay up to date on what they can start working on in their phase of the project.
4. Pinpoint milestones
Unlike most tasks in a Gantt chart, milestones are fixed points in time. Think of them as checkpoints to signify that large pieces of work are complete. They help your team know what to prioritize and can be great moments of celebration when they’re completed.
Tip: Milestones often occur at the end of project phases, but there’s no single way to create milestones for your team, especially since every team and project looks different. Examples of milestones might look like:
Meetings
Project approvals
Task starting points
Mid-phase check-ins
Phase completion points
5. Modify work as plans change
Plans inevitably change, so your Gantt chart software should adapt to your needs. Look for a tool that allows you to easily drag and drop tasks, and that automatically updates dependencies in real time. That way, you can always keep your project on track, even as plans shift.
Gantt chart best practices
When teams first start using Gantt charts, they often encounter a few common hurdles. These challenges can lead to miscommunication, resource misallocation, and ultimately, project delays.
However, with the right best practices in place, Gantt charts become powerful tools for improving project visibility and team coordination. The following Gantt chart best practices are designed not just as tips but as solutions to these common initial stumbling blocks.
Read: What is an implementation plan? 6 steps to create your ownDetermine the critical path
Establishing the critical path of a project timeline is key to understanding the sequence of tasks that directly affect the project's completion date. This practice involves identifying which tasks are critical (i.e., any delay in these tasks will delay the project) and which tasks have float (i.e., can be delayed without affecting the project timeline).
By focusing on the critical path, project managers can allocate resources more effectively and prioritize tasks essential to on-time project completion.
Example: In a software development project, tasks such as requirement gathering, design, coding, testing, and deployment are mapped on a Gantt chart to identify the critical path. It reveals that delays in the coding phase directly affect testing and deployment timelines. However, tasks like documentation might have some float and can be adjusted if coding takes longer. This insight enables project managers to prioritize coding and allocate additional resources when necessary, ensuring the project stays on schedule despite potential bottlenecks.
Read: Free critical path templateUse a work breakdown structure
A work breakdown structure (WBS) is a fundamental step in project planning that involves dividing a project into manageable tasks and subtasks. When applied to a Gantt chart, a WBS helps organize tasks visually, making it easier to monitor progress and allocate resources efficiently.
Example: Consider a project to develop a new website. By using a WBS, you would break down the project into smaller tasks such as design, content creation, and coding. Each task would then be represented on the Gantt chart timeline, giving team members a clear overview of the project scope that helps them understand their responsibilities and deadlines.
Read: The 10 best workflow management software toolsIdentify task dependencies
Understanding task dependencies is crucial for creating an accurate Gantt chart. Task dependencies indicate the relationship between tasks and subtasks, showing which tasks must be completed before others can begin. This ensures that the project flows logically and resources are allocated appropriately.
Example: For a construction project involving the building of a structure, it's essential to complete foundational subtasks before advancing to subsequent phases, such as erecting walls. The Gantt chart efficiently maps these work dependencies, ensuring contractors recognize the importance of completing the foundation and avoiding scheduling conflicts and inefficient resource use.
Read: Understanding dependencies in project managementAllocate resources wisely
Resource allocation involves assigning the appropriate resources, including team members, equipment, and budget, to specific tasks. A Gantt chart with integrated resource allocation allows project managers to see not only when tasks are scheduled but also how resources are distributed across the project.
Example: For an event-planning project, a Gantt chart can show that while one team works on venue setup, another team is arranging catering. Task visualization ensures that resources are not overstretched and that tasks are adequately staffed. This helps prevent burnout and ensures that all aspects of the project are covered.
Read: Free resource allocation plan templateMonitor progress regularly
A Gantt chart is not a set-and-forget tool; it requires regular updates to reflect the project's current status. Incorporating dashboards into this practice provides a centralized, real-time view of project progress, task completion, and resource allocation. Dashboards complement Gantt charts by offering an at-a-glance summary of key project metrics, enabling project managers and team members to quickly assess project health and make informed decisions.
Read: What is a sprint backlog? Template and exampleExample: During a software development sprint in an agile project, if a sprint is behind, a dashboard updated alongside the Gantt chart quickly highlights delays and resource issues. This allows for immediate adjustments to make certain the project stays on track without extensive meetings or email updates. This streamlined approach keeps everyone aligned and responsive to changes.
Create a Gantt chart templatePros and cons of Gantt charts
While these charts can be helpful, they aren’t always the best for every project. To better understand if this type of project chart is right for you and your project vs. a timeline, here are a few considerations before you leap into creating one.
Pros
Get a bird’s-eye view of your project timeline: A Gantt chart is a roadmap of your project. This tool helps you track when you should reach each milestone and whether you’re on track to do so. This type of timeline view offers a bird’s-eye perspective on your work, making it a particularly useful tool for presenting a quick overview to senior management or clients.
See how tasks relate to each other: By adding start and finish dates to each task and drawing dependencies, you can visualize how each piece of work affects another. This helps you identify problems and fix dependency conflicts before you start.
Improve team resource management: Assigning an owner to each piece of work can help you see who’s doing what and when, so you can better manage individual workloads. Since everything is plotted out sequentially, you’ll be able to see whether an individual teammate or team has too much to do at one time and reassign or reschedule tasks as needed.
Cons
More time-consuming to set up: Setting up a Gantt chart can be time-consuming, especially if you’re using a Microsoft Excel spreadsheet. Even if you use a template, you might still have to make adjustments to customize it to your team’s specific needs.
Difficult to manage the project in the same place you planned it: Traditional Gantt charts are most useful in the planning phase of a project. Once you’ve mapped out your work, you’ll likely need to use a different tool or platform to manage day-to-day activities, making it hard to know where your team’s single source of truth is.
Adding more details gets messy: Adding context around deadlines and collaborators to your project plan on a Gantt chart can turn it from an easy-to-view map to an overwhelming sheet of chaos.
Alternatives to traditional Gantt charts
![[Product UI] Brand campaign project example (Boards)](https://assets.asana.biz/transform/0bf24409-8788-4d08-a745-84550c9502a2/inline-generic-boards-2x?io=transform:fill,width:2560&format=webp)
Fortunately, there are alternatives to clunky charts that still give you a bird’s-eye view of how all your work fits together, without the typical limitations of a traditional, spreadsheet-based chart. A work project management tool like Asana can help you manage, coordinate, and add details to your work in the same place you plan it, while also spending less time setting everything up.
Read: Introduction to work managementFor example, you could set up your project plan using Asana’s Timeline, a view that lets you map out how all the pieces of your project fit together. Like a Gantt chart, Timeline shows you when each step will happen, how long it will take, and who’s responsible. Unlike a Gantt chart, Timeline is easy to set up and maintain and lets your team collaborate on work in the same place you planned it.
Gantt chart vs. Kanban board vs. timeline vs. PERT chart
Different project views help teams manage different types of work. A Gantt chart or timeline works well when you need to plan work against dates, while a Kanban board helps you track tasks by status. A PERT chart helps teams map task relationships and estimate project duration.
Project view | Best for | What it tracks | Use when |
Gantt chart | Planning and tracking work on a schedule | Tasks, start dates, end dates, durations, dependencies, and milestones | You need to manage a project timeline, track deadlines, and understand how task delays affect later work. |
Kanban board | Managing work by status | Tasks grouped by columns, such as To do, In progress, and Done | You need to track work as it moves through stages, especially for ongoing work or agile workflows. |
Timeline | Showing major dates and milestones | A high-level sequence of work, events, deadlines, or phases | You need a simple project overview without detailed task dependencies or day-to-day work tracking. |
PERT chart | Mapping task relationships and estimating project duration | Tasks, dependencies, and the path of work needed to complete the project | You need to plan a complex project, estimate timing, and identify which tasks could affect the final deadline. |
Depending on the work you’re managing, a calendar, Kanban board, list, or timeline may give your team a better view than a traditional Gantt chart. With Asana, you can switch between Timeline, List, Board, and Calendar views, so each teammate can review the same project in the format that works best for their role. You can test out all of these views with a free Premium trial.
11 best kanban boards software tools compared.How to Improve Gantt Charts With AI
AI can make Gantt charts easier to create and maintain, especially for projects with many tasks, dependencies, and changing deadlines. Instead of building a timeline from scratch, teams can use AI to draft a project plan, suggest task sequences, estimate durations, and flag scheduling conflicts before work begins.
AI can also help keep Gantt charts useful as projects change. For example, if a launch date shifts or a task falls behind, AI can suggest timeline adjustments, identify affected dependencies, and summarize the changes for stakeholders. AI helps teams spend less time manually updating the chart and more time making decisions about owners, priorities, and next steps.
Common ways teams use AI with Gantt charts include:
Creating a first draft of a project timeline from a brief or project goal
Breaking large phases into smaller tasks
Suggesting task owners, deadlines, and dependencies
Identifying scheduling conflicts or overloaded periods
Summarizing timeline changes for status updates
Recommending next steps when deadlines shift
AI works best when you pair its suggestions with team input. Use it to draft timelines, spot potential issues, and summarize changes, then refine the plan based on capacity, deadlines, and stakeholder needs.
Plan projects like a pro with Asana
Whether you use a Gantt chart maker or a similar tool, visualizing your project plan is a key step for every team, whether you’re a project manager or not. It allows you to show how all the pieces of your project fit together, share it with your team, and adapt your plan as work progresses to keep everything on track.
Map out your project plan and watch the pieces come together with Asana.
Create a Gantt chart template