Milestone chart: Definition, steps, and a template

Summary
A milestone chart is a way to visualize the most important steps of your project. Each milestone your team achieves brings you closer to completing your project. In this way, milestones provide a sense of accomplishment and show your team how their work contributes to the overarching project objective.
Milestones aren't just important for your team. They also simplify your role as the project manager. You can share your milestone chart with project stakeholders to visualize your project's progress and ensure everyone is on the same page.
How do you create a milestone chart?
We'll look at different ways to create a milestone chart. You'll also learn about the main parts of a good milestone chart, when to use one, and how celebrating milestones can boost team morale.
Master AI-Powered Workflow Optimization
Ready to revolutionize your team's productivity with AI you can trust? Join industry leaders from Asana and Anthropic to learn proven strategies for implementing AI across your workflow stages and unlock the full potential of Asana's AI Studio.
What is a milestone chart?
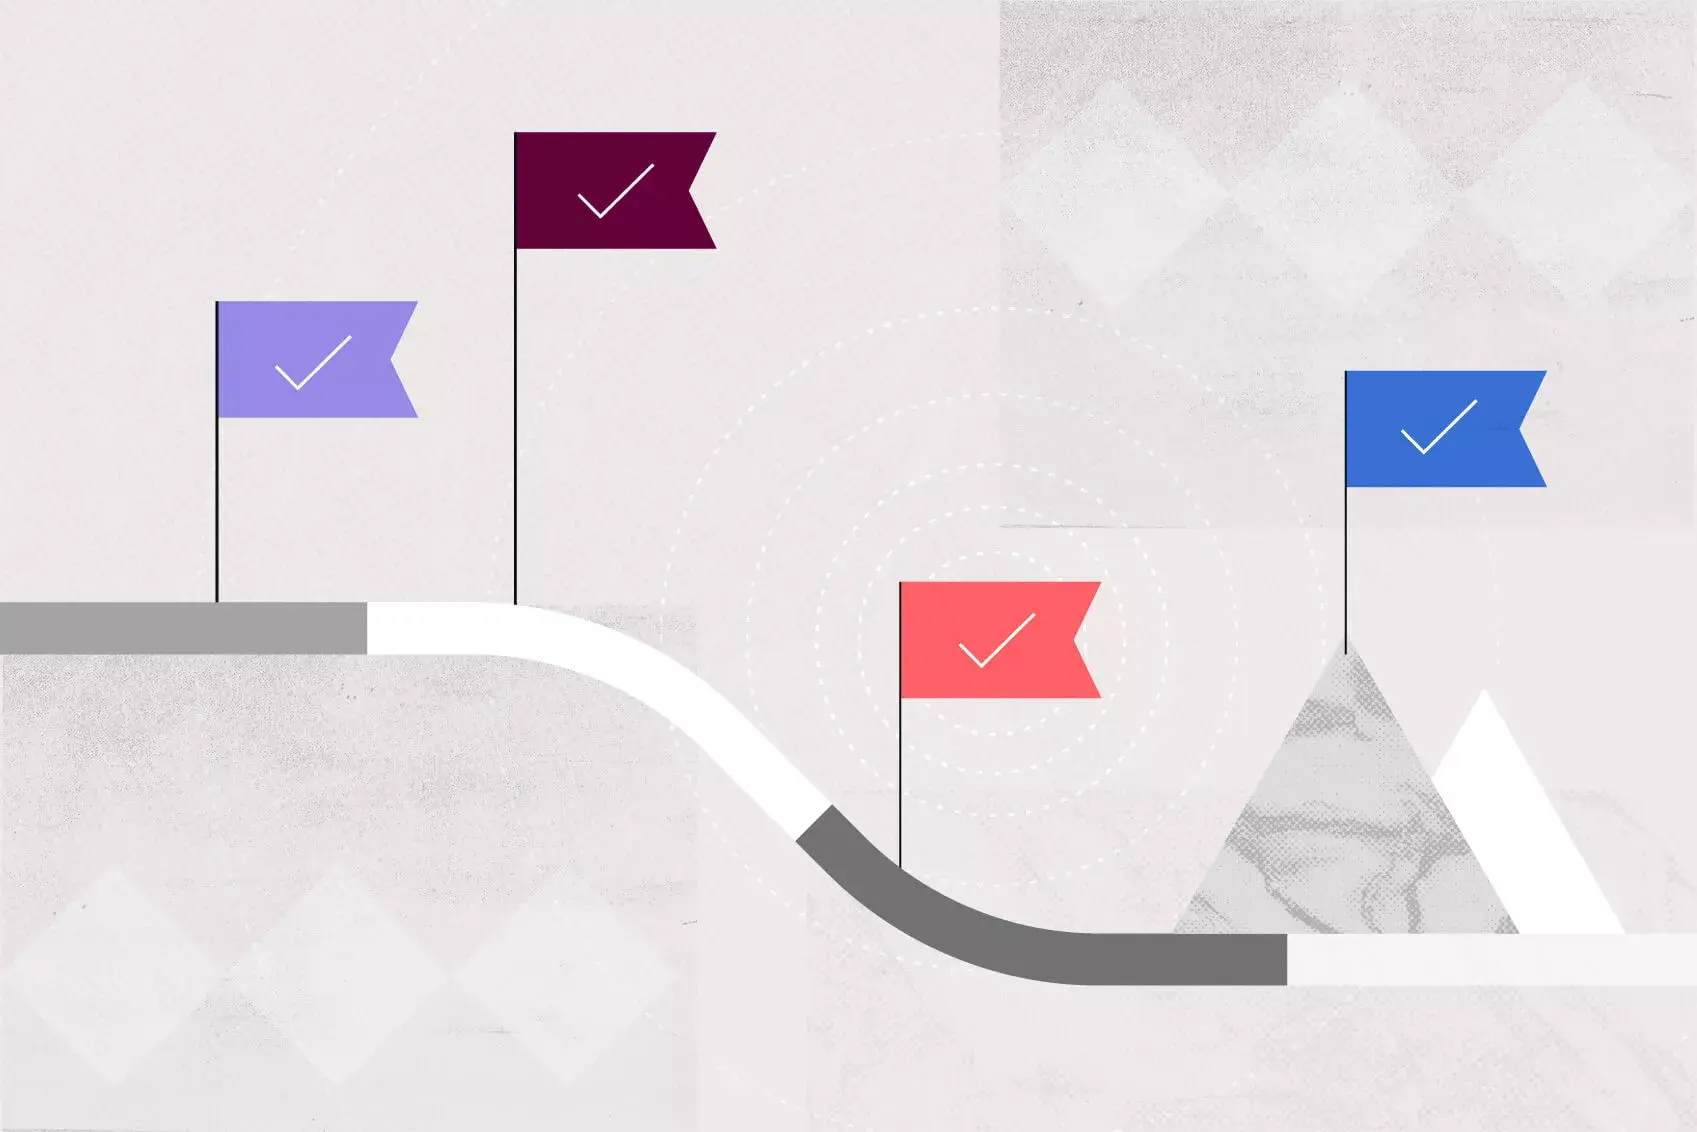
A milestone chart is a visual tool that shows the main checkpoints in your project timeline. It highlights key achievements and deadlines, making it easy for teams and stakeholders to see progress. Unlike Gantt charts, milestone charts focus only on big deliverables and phase completions.
![[inline illustration] what are milestones and why are they important (infographic)](https://assets.asana.biz/transform/fdb6d0bc-58d0-47ac-8c7a-6cf238f66812/inline-project-management-milestone-charts-1-2x?io=transform:fill,width:2560&format=webp)
Milestones are like steps on a ladder. Each one you reach brings you closer to finishing your project.
Key components of a milestone chart
A good milestone chart has a few key parts that help you track progress:
Milestone markers: Clear indicators that highlight significant project achievements or checkpoints.
Timeline or date axis: A horizontal representation showing when each milestone should be reached.
Milestone descriptions: Brief explanations of what each milestone represents and why it matters.
Dependencies: Visual connections showing how milestones relate to one another.
Ownership: Assignment of responsibility for each milestone to specific team members or departments.
Status indicators: Visual cues showing whether milestones are pending, in progress, or complete.
Including these parts makes your milestone chart a strong tool for keeping everyone on the same page.
Difference between milestones and tasks
Tasks and milestones have different roles in your project plan:
Aspect | Tasks | Milestones |
Definition | Specific activities your team completes | Significant checkpoints marking key moments |
Duration | Have start and end dates | No duration (a single point in time) |
Purpose | Day-to-day work that moves the project forward | Achievements or transitions between phases |
Examples | Draft press release, design logo | Brand assets finalized, product launched |
Put simply, tasks are the work your team does, and milestones are the big achievements they reach.
Milestone chart vs Gantt chart
Milestone charts and Gantt charts both show project timelines, but they are used for different reasons and by different people.
Feature | Milestone chart | Gantt chart |
Level of detail | High-level checkpoints only | Every task, duration, and dependency |
Primary audience | Executives, stakeholders, clients | Project managers, team members |
Best for | Status updates and presentations | Day-to-day project execution |
Complexity | Simple and quick to scan | Detailed and comprehensive |
A Gantt chart helps people who are doing the work plan their tasks. A milestone chart is for those who need to see the big picture, like managers or clients. Many teams use both, depending on who needs the information.
Benefits of using a milestone chart
Milestone charts have several benefits for both project managers and stakeholders.
Improved clarity: By focusing on key achievements rather than every task, milestone charts provide a clear overview of project progress without overwhelming detail.
Improved stakeholder communication: Executives and clients can quickly understand where a project stands without needing to review complex schedules.
Better progress tracking: Milestones serve as natural checkpoints, making it easier to identify whether your project is on track or falling behind.
Increased accountability: When milestones are clearly defined and assigned, team members understand exactly what they're working toward and when.
Efficient planning: Milestone charts help you break large projects into manageable phases, making it easier to allocate resources and set realistic deadlines.
Team motivation: Reaching milestones gives your team a sense of accomplishment and momentum throughout the project lifecycle.
When to use a milestone chart
Milestone charts are particularly effective in certain scenarios. Consider using one when:
Managing complex, multi-phase projects: When your project spans several months or involves multiple teams, milestones help you track progress at a meaningful level.
Reporting to executives or stakeholders: Leadership rarely needs to see every task. A milestone chart gives them the high-level view they need to make decisions.
Working with external clients: Milestone charts help manage client expectations by showing key deliverables and deadlines without exposing internal operational details.
Coordinating cross-departmental initiatives: When multiple teams contribute to a project, milestones provide shared reference points that keep everyone aligned.
Tracking strategic goals: Milestones can connect daily work to broader business objectives, helping teams see how their efforts contribute to company priorities.
If your project is simple, a task list may be enough. But if you have many stakeholders or a long timeline, a milestone chart is very helpful.
Different ways to create milestone charts
You can create a milestone chart in several ways:
Project timeline template: Add milestones directly to an existing timeline structure.
Gantt chart: Use a horizontal bar chart to visualize your project schedule and milestones.
Work management software: Use a dedicated timeline tool for real-time updates and easy sharing.
Gantt charts are helpful, but they can take a long time to set up and can get cluttered with too many details. You can read more about their pros and cons in our full guide.
Read: New to Gantt charts? Start hereA modern project timeline tool is a great alternative to a traditional Gantt chart. Let's look at why using a dedicated planning and timeline tool can help you create your milestone chart.
Why should you use a project management tool to create your milestone charts?
To get the same bird's-eye view of your project that a Gantt chart offers, use a timeline tool in your designated work management software. There are several advantages to using a timeline tool over a Gantt chart:
A timeline tool is easy to set up and maintain, especially when you have to add new tasks or adjust milestones.
Tasks and other underlying work can be linked to your timeline and will update in real time.
With a single click, you can share your timeline with your team or stakeholders.
7 steps to create a milestone chart
Let's go through the steps to create a milestone chart, starting with setting your project goals.
Create a milestone chart templateStep 1: Define project goals
Before you create your milestone chart, you'll need to outline your project's general timeline and goals in a project brief. Defining your project goals gives your team a thorough understanding of your targeted project outcome. This way, your team knows exactly what they're working towards and why it matters.
Example: Let's say you're a communications director, and your company is merging with another one. Your overarching project goal is to successfully merge the two companies. The start date of your project is the creation of the internal announcement; the end date is the global company event celebrating the successful merger.
Read: How to write an effective project objective, with examplesStep 2: Create a task list
Once you have your timeline and main project goal, make a task list. List the tasks in order and, if possible, add dates for each one.
Among other tasks, your responsibilities for the company merger will include creating the internal announcement newsletter, scheduling Q&A sessions with employees, organizing press conferences to announce the merger externally, and planning the global merger event.
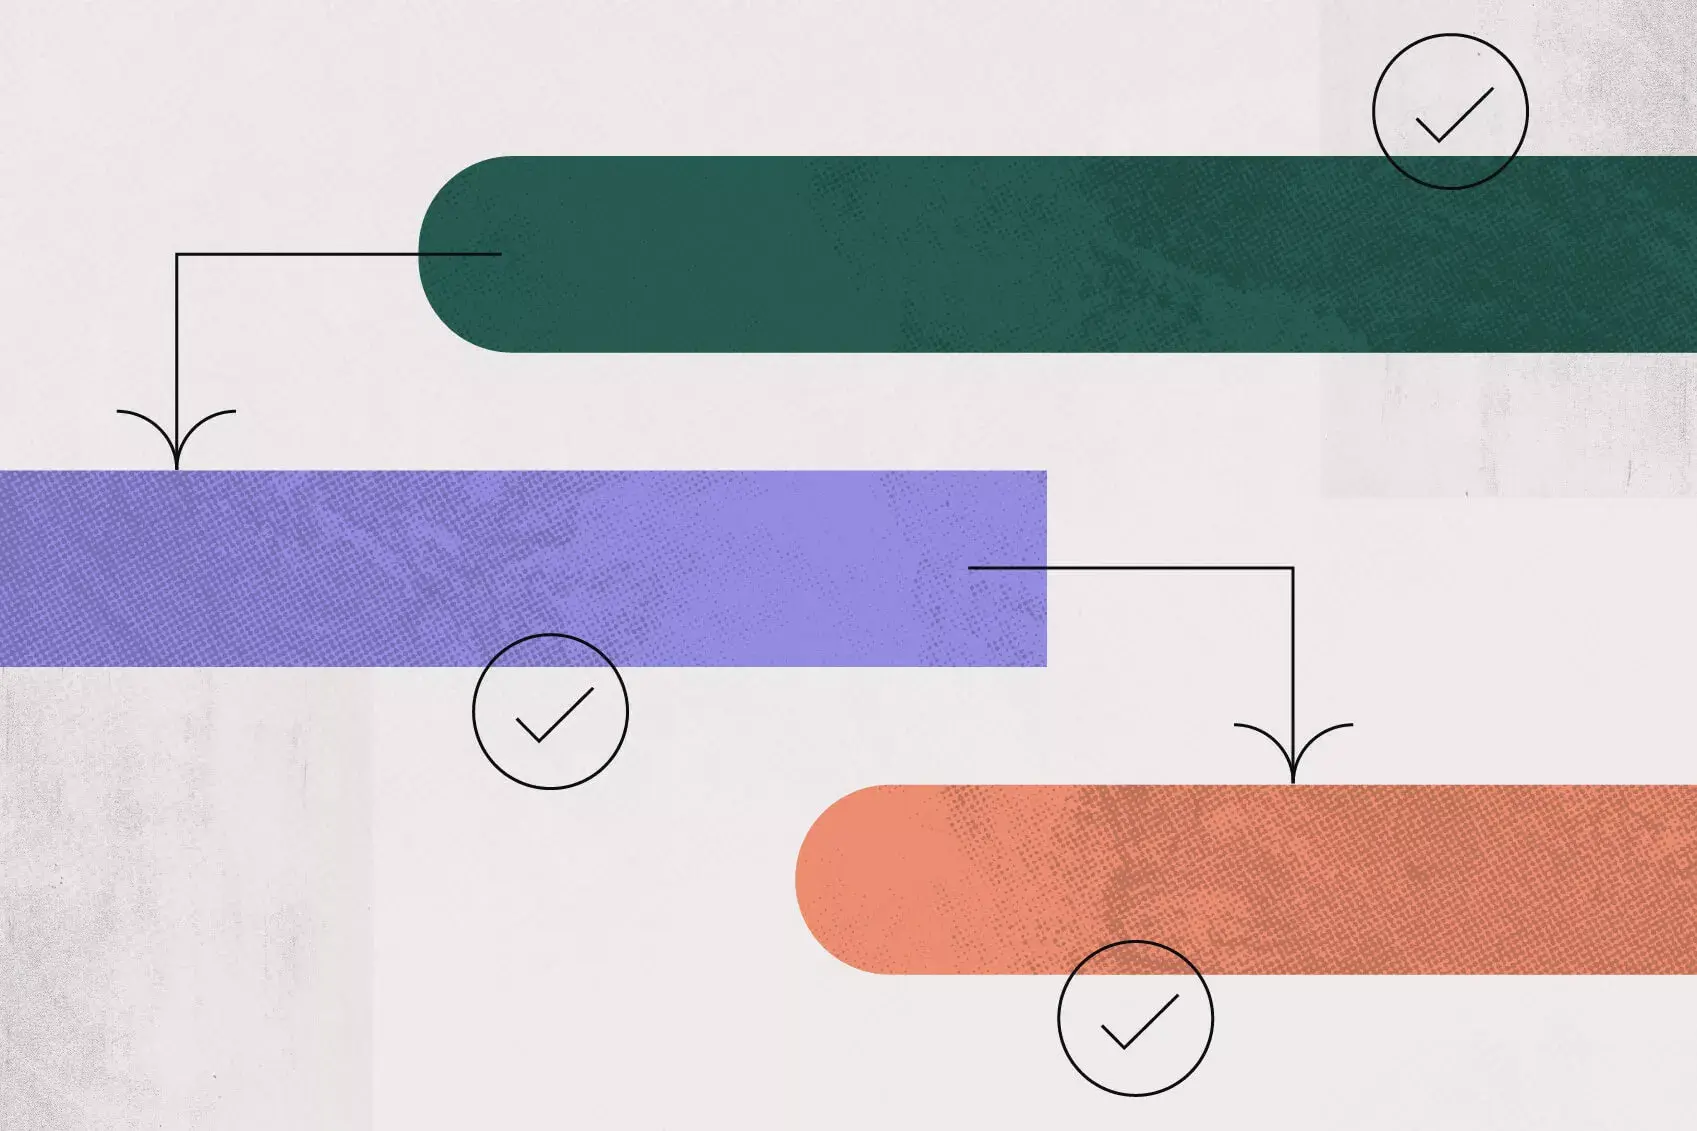
Step 3: Identify milestones
To find your milestones, you need to know what counts as a milestone and what does not.
![[inline illustration] know what a milestone is and what it is not (infographic)](https://assets.asana.biz/transform/287607f5-f47c-4d77-954f-12dcd9bcec04/inline-project-management-milestone-charts-3-2x?io=transform:fill,width:2560&format=webp)
Goals are usually more important than milestones. A goal explains what happens when your project succeeds and how it fits with business objectives. A milestone marks a key point you are working toward or have already reached.
People often mix up milestones and deliverables. A deliverable is something you can see or use, like a report or product. A milestone is a key moment or checkpoint in the project.
You can identify whether or not something qualifies as a milestone by considering the following questions:
Does this task affect your deadline?
Is this a significant point in your project that indicates progress?
Should this task be reviewed by your stakeholders?
Can the project still be completed without this task?
If you answered yes to all the questions except the last one, you have found a milestone.
Example: To build out your merger project and to-dos, you must first categorize each initiative:
Creating the internal newsletter to announce the merger is a task.
Sending out the newsletter is a project deliverable.
Announcing the merger to the company (the completion of the above two to-dos) is a milestone.
Step 4: Create your timeline
Now it's time to assemble the puzzle and turn your tasks, goals, phases, deliverables, and milestones into a timeline. Take a look back at the timeframes you added to your project deliverables and verify if the phases are long enough. This is also a great opportunity to check for any dependencies that could cause a bottleneck.
Add all of your project tasks and phases to your timeline tool, define dependencies, adjust phases where necessary, and then indicate to-dos, deliverables, and key milestones. Once you've finalized your project timeline, you should have a clear visualization of your entire project plan.
Example: A project the size of a company merger will naturally have some tasks or phases that can't get started until others are completed. For example, you'll need the updated logos from your marketing team before you can send the press release announcing the merger.
Step 5: Share your timeline
Once your timeline is ready, share it with your team to make sure nothing is missing. They can check that all dependencies are set and that each phase has enough time.
After your main team checks the timeline, share it with the rest of your team. This helps everyone see what tasks and phases they need to complete to reach the milestones.
Example: Four eyes see more than two. After sharing your milestone chart with a communications manager, they find that you didn't allocate enough time to prepare the internal Q&A sessions for employees. By adjusting the timeline, you can give your team enough time to prepare for this project phase.
Read: How to create project schedules to make work easierStep 6: Add documentation
Throughout the project lifecycle, add any documents, notes, and relevant communications to the tasks, phases, or milestones they relate to. Your milestone chart is never final; it's a growing project management tool that needs to be updated and expanded to stay in sync with your project.
Linking important information to your timeline helps your team see what’s done, what’s in progress, and what still needs to be finished.
Example: Once the marketing team has shared the new logo, link the file to the respective task in your timeline. This allows everyone else working on the project to easily locate and use the design when needed.
Step 7: Celebrate milestones
When your team reaches a milestone, take time to celebrate. You might order pizza, let the team leave early, or give out coffee shop gift cards. Celebrating milestones shows you value your team’s effort and keeps everyone motivated.
Each time your team completes a milestone, you move closer to finishing the project. Keep tracking progress with your timeline and share updates with stakeholders.
Read: Work hard, better: Leading your team to better resultsExample: Your team has worked tirelessly to pull off the most amazing global company event marking the official merger of the two companies. Everyone had a great time, and your CEO even mentioned how happy they are with the outcome of the event. You could celebrate this milestone by giving your entire team the following Monday off to recharge before the project post mortem.
Best practices for milestone chart management
Making a milestone chart is only the first step. To get the most out of it, follow these best practices:
Set realistic target dates: Base your milestone dates on realistic estimates, not wishful thinking. Build in buffer time for unexpected challenges.
Assign clear ownership: Every milestone should have a responsible owner who can report on progress and flag issues early.
Review and update regularly: Your milestone chart should evolve as your project progresses. Schedule regular check-ins to adjust dates as needed.
Keep milestones meaningful: Avoid creating too many milestones. Focus on truly significant achievements that mark real progress.
Link milestones to broader goals: Connect your project milestones to strategic objectives, so your team understands the bigger picture.
Communicate changes promptly: When milestone dates shift, update your stakeholder register and inform stakeholders immediately. Transparency builds trust even when timelines change.
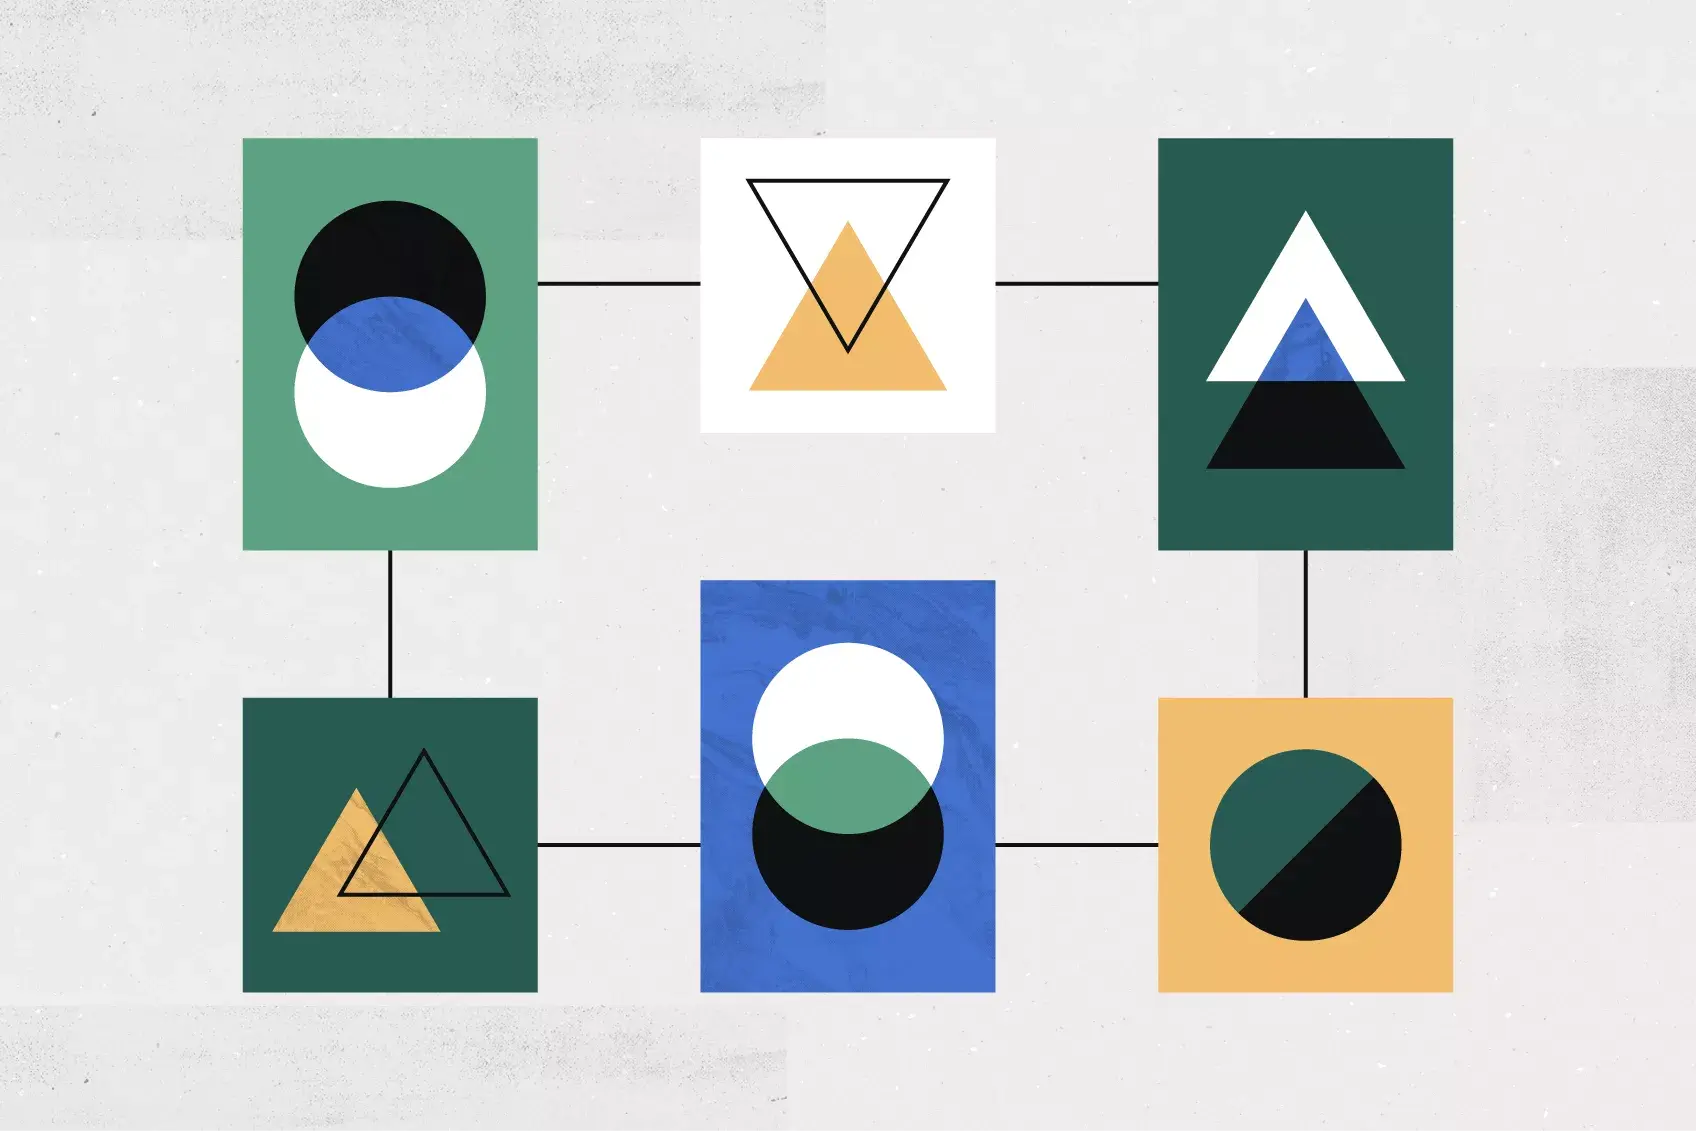
Other ways to plan your milestones
While a timeline is the best way to outline your work and get an expansive overview of tasks, deliverables, and deadlines, other project charts can also help you visualize and plan your milestones.
![[inline illustration] alternative ways to visualize milestones (infographic)](https://assets.asana.biz/transform/dd7b8f7f-fdae-4ff5-8f30-7fd78c4080ec/inline-project-management-milestone-charts-4-2x?io=transform:fill,width:2560&format=webp)
While these visualizations may not be the best project management tools, they're great for presentations or brainstorming.
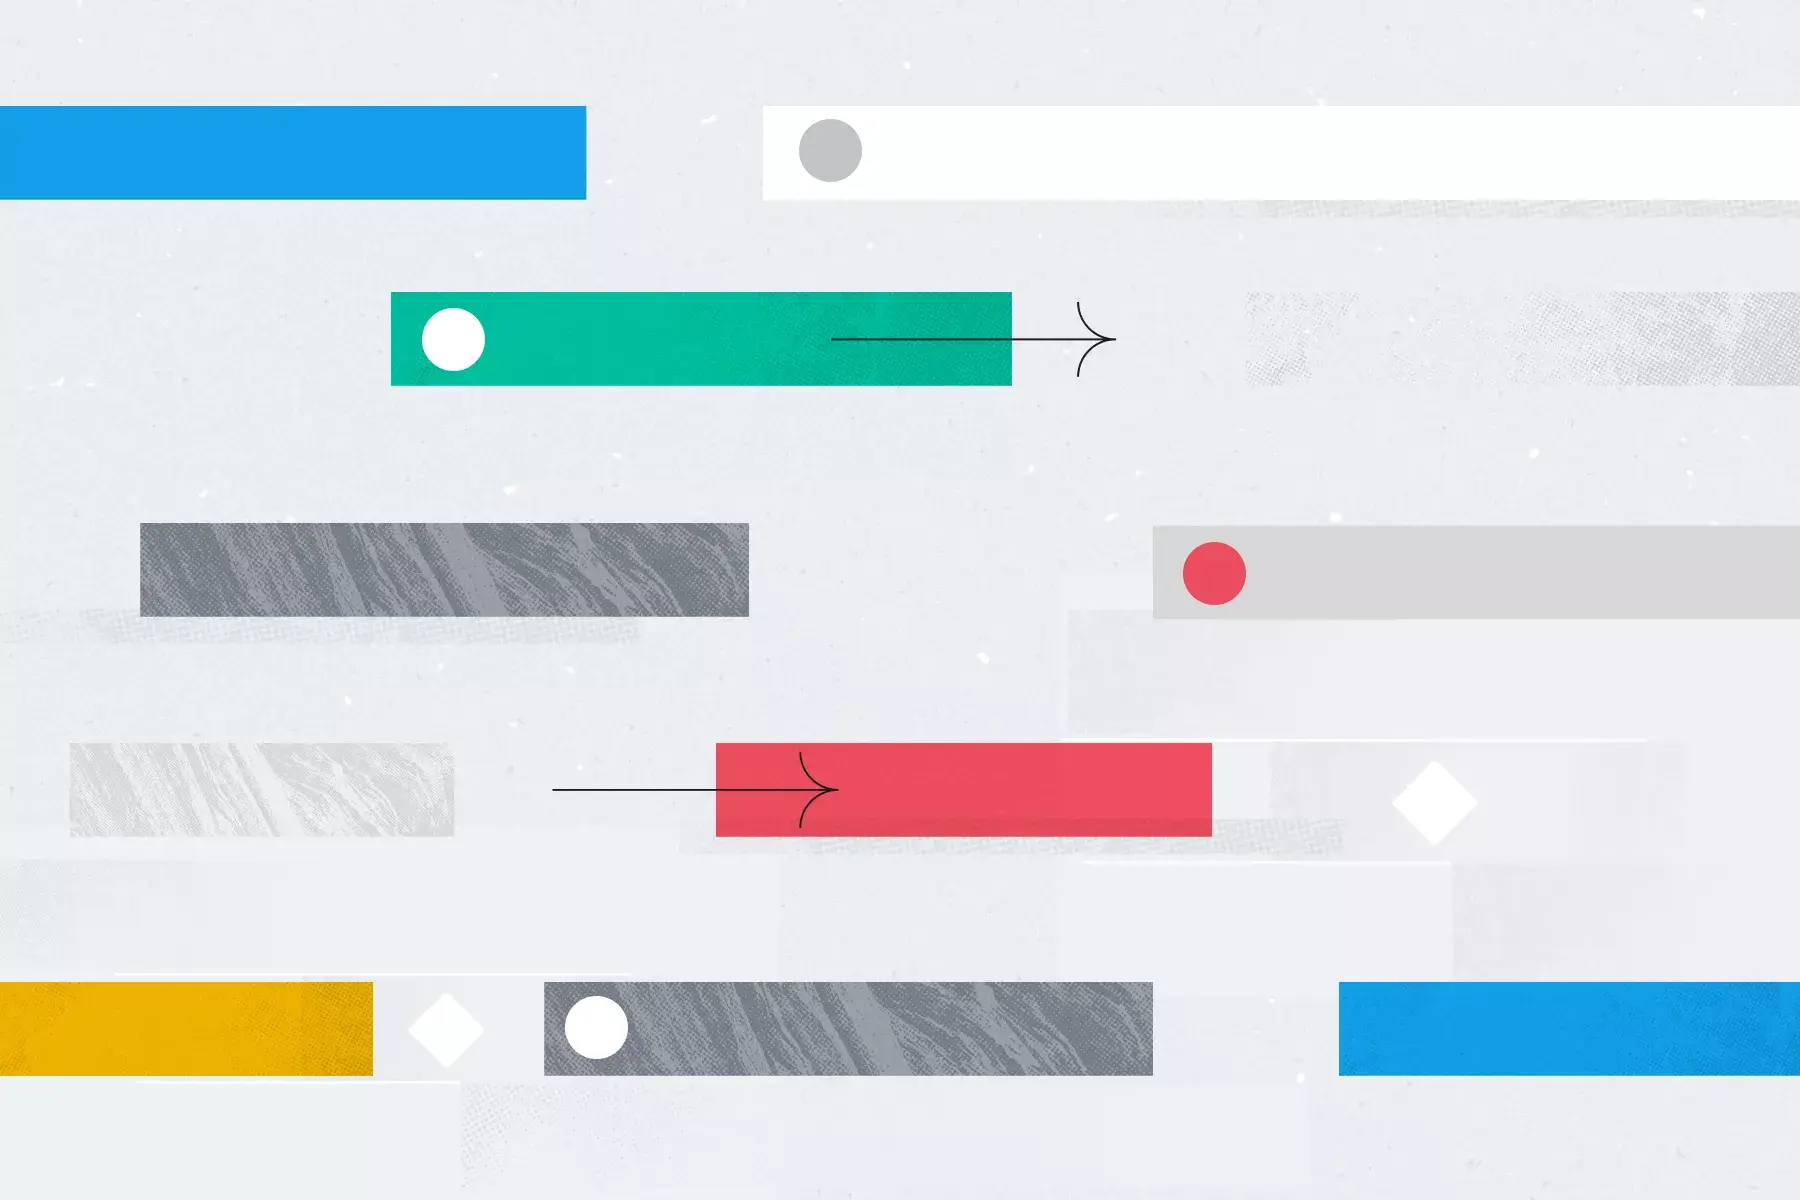
For example, during a company merger, your communications team might share a simple version of the timeline in the internal newsletter. Sharing the full timeline with everyone is usually unnecessary and could be risky.
Instead, create a simplified visual highlighting only the milestones or a modified version of your Kanban board so the company's employees get a better sense of who is contributing to what.
![[inline illustration] what are milestone charts (infographic)](https://assets.asana.biz/transform/844a02c1-1e0f-4bd7-ab49-5f5a8cf778ae/inline-project-management-milestone-charts-5-2x?io=transform:fill,width:2560&format=webp)
Streamline your milestone tracking with Asana
If you're ready to try timelines instead of traditional Gantt charts, check out Asana's Timeline tool. Use one of Asana's existing milestone chart templates or create your own.
Already have a milestone chart in Excel? You can import your CSV file directly into Asana. Get started today and keep your team aligned on every important checkpoint.
Create a milestone chart template