What Is Process Mapping? Steps, Types, Examples & Template

Summary
Delivery delays. Missed reviews. Duplicate work. These aren't productivity issues, they're process issues. When no one sees how the whole workflow fits together, even simple tasks can get stuck. That's where process mapping comes in. It makes the invisible visible.
A process map gives you a visual representation of how work gets done. It helps teams spot bottlenecks, clarify responsibilities, and streamline even the most routine workflows. In this guide, we'll walk through who uses process mapping, the benefits it offers, the types of maps you can create, and how to build one that helps your team work smarter.
Discover the future of workflow automation
Leverage AI-driven solutions to unleash your team's potential with dynamic workflows that adapt to ever-changing business needs and drive company-wide success.
What is process mapping?
Process mapping is a technique for visually documenting how work flows from start to finish. It creates a diagram, often called a flowchart or workflow diagram, that shows each step, decision point, and handoff in a process so teams can understand, communicate, and improve how work gets done.
The purpose of process mapping is to communicate how a process works in a simple, clear way. Instead of walking someone through it verbally, you can give them the map. Mapping a process from beginning to end makes it easier to spot what's working and what's not.
Solving recurring issues
Documenting complex workflows
If a specific process feels messy or misunderstood, workflow mapping can help clarify things for everyone.
Who uses process mapping?
Process mapping is used across industries and roles, from small teams to enterprise organizations. Here are some of the people who benefit most from this technique:
Business analysts use process mapping to understand and document how business processes work, identify inefficiencies, and recommend improvements.
Operations managers rely on process maps to standardize workflows, reduce waste, and improve team coordination.
Project managers create process maps to plan complex initiatives, clarify dependencies, and keep stakeholders aligned.
HR and training teams use process maps to document onboarding workflows, explain policies, and help new employees get up to speed faster.
IT and enterprise architects map system integrations and data flows to support software development and automation projects.
Consultants use process mapping to help clients visualize their current state and design more efficient ways of working.
If your team needs to explain, improve, or standardize how work gets done, process mapping can help.
Why use a process map?
A process map turns ideas into clear steps your team can follow. It's a simple way to plan work, spot issues, and improve how things get done.
Here's how process mapping can help:
Find inefficiencies: See where tasks pile up, break down, or get missed.
Simplify ideas: Break big ideas into small steps.
Plan for "what ifs": Build contingency plans and handle roadblocks before they happen.
Clarify roles: Specify who's responsible for each process step.
Create process documentation: Create a repeatable guide anyone can follow.
Communicate clearly: Use a simple visual to get everyone on the same page.
Make decisions faster: Less back-and-forth means quicker decision-making.
Support your team: Help people feel confident in their work.
Stay compliant: Comply with standards like ISO 9000 and ISO 9001.
Types of process maps
Process maps come in all shapes and sizes. They all serve the same purpose, but certain types may be better suited for particular projects. Here's a quick comparison:
Process map type | Best for | Complexity |
Flowchart | Simple, sequential processes | Low |
High-level process map | Executive overviews and scoping | Low |
Detailed process map | Complex workflows and audits | High |
Swimlane map | Cross-functional processes | Medium |
Value stream map | Lean process improvement | High |
SIPOC diagram | Scoping before detailed mapping | Low |
BPMN | Automation and system integration | High |
Here's a closer look at each type and when to use it.
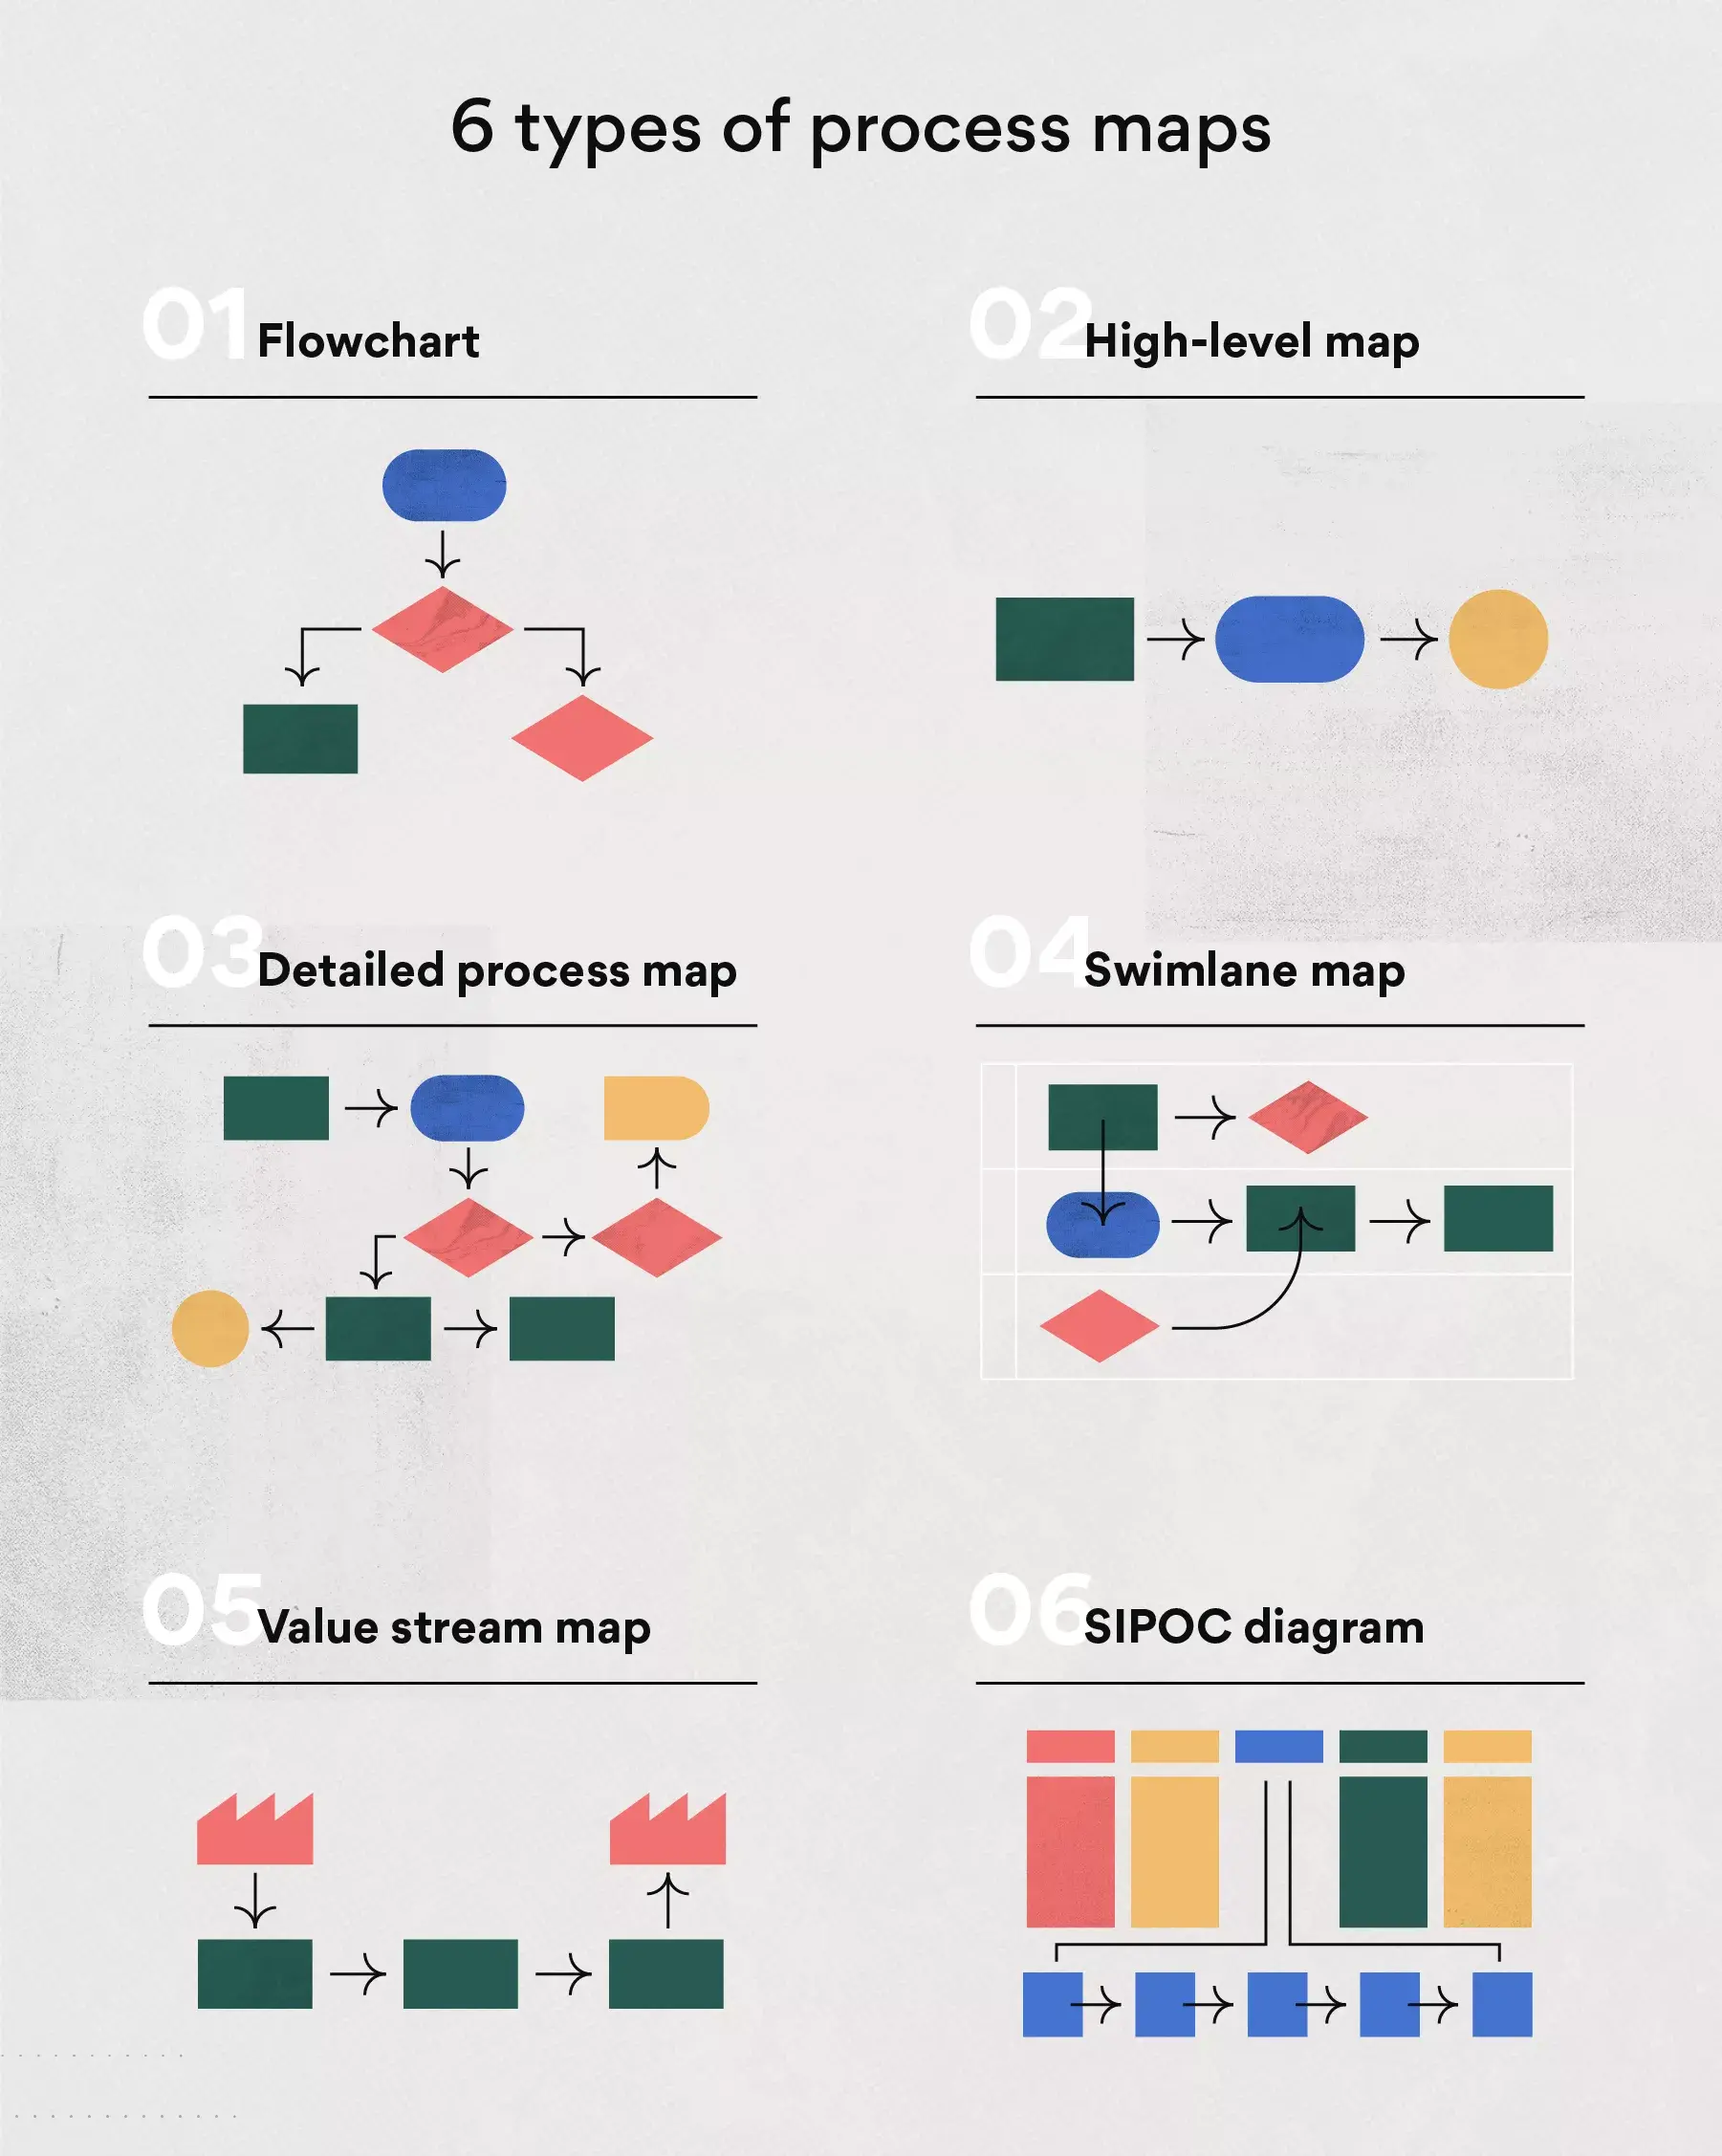
Flowchart
The basic flowchart is the simplest and most widely used type of process map. It uses standard process mapping symbols to show the inputs, outputs, and process steps from start to finish.
Plan a new workflow
Fix problems in a process
Improve team communication
It's also a great starting point for documenting processes during onboarding or brainstorming sessions.
Best for: Showing how a specific process flows from start to finish in clear, sequential steps.
High-level process map
Also known as a top-down or value chain map, this version offers a bird's-eye view of a business process. It skips the fine details and focuses on the key phases.
A high-level process map is helpful when you're:
Defining a new process structure
Sharing overviews with execs or external partners
Scoping before building a detailed map
Best for: Communicating essential steps without getting into the weeds.
Detailed process map
This map includes everything: actions, decisions, subprocesses, inputs, outputs, metrics, and contingencies. It often marks decision points clearly and shows exactly who's responsible for what.
It's ideal for:
Analyzing complex workflows
Finding inefficiencies or delays
Standardization of new projects at scale
Best for: Providing a complete, thorough picture of how a process works.
Swimlane map
A swimlane diagram, also known as a cross-functional flowchart, organizes a process by separating responsibilities into horizontal or vertical "lanes." Each lane represents a person, role, or team.
Use it to:
Highlight accountability
Track handoffs between departments
Improve coordination in cross-functional workflows
Clarifying roles during process changes.
Best for: Clarifying roles and responsibilities in multi-team processes.
Value stream map
A value stream map is a lean tool for tracking the entire journey of a product or service from start to delivery. It uses a special set of mapping symbols to represent how information and materials move through each step.
It captures data and metrics like:
Cycle time
Number of people involved
Where waste or delays occur
Best for: Tracking how value is delivered to customers and finding opportunities to reduce waste.
SIPOC diagram
A SIPOC diagram stands for Suppliers, Inputs, Process, Outputs, and Customers. It's a structured chart, not a flow-style process map, that gives a high-level view of a workflow before you build a more detailed process map.
Use this process mapping tool with Six Sigma methodology or any structured process mapping exercise. Each of the five SIPOC columns helps clarify the process and the stakeholders involved.
Use one to:
Define the scope of complex processes
Identify all components and team members
Set clear boundaries for process improvement projects
Best for: Outlining what's involved before mapping the full workflow.
BPMN (Business Process Model and Notation)
BPMN is a standardized method for business process mapping. It uses unique symbols to show how tasks, events, and decisions flow, which makes it easier to align technical and non-technical teams.
It's great when you need to:
Document logic across tools or systems
Build workflows that will be automated later
Support software integrations or process development
Best for: Mapping structured, often automated processes that need clarity across systems and teams.
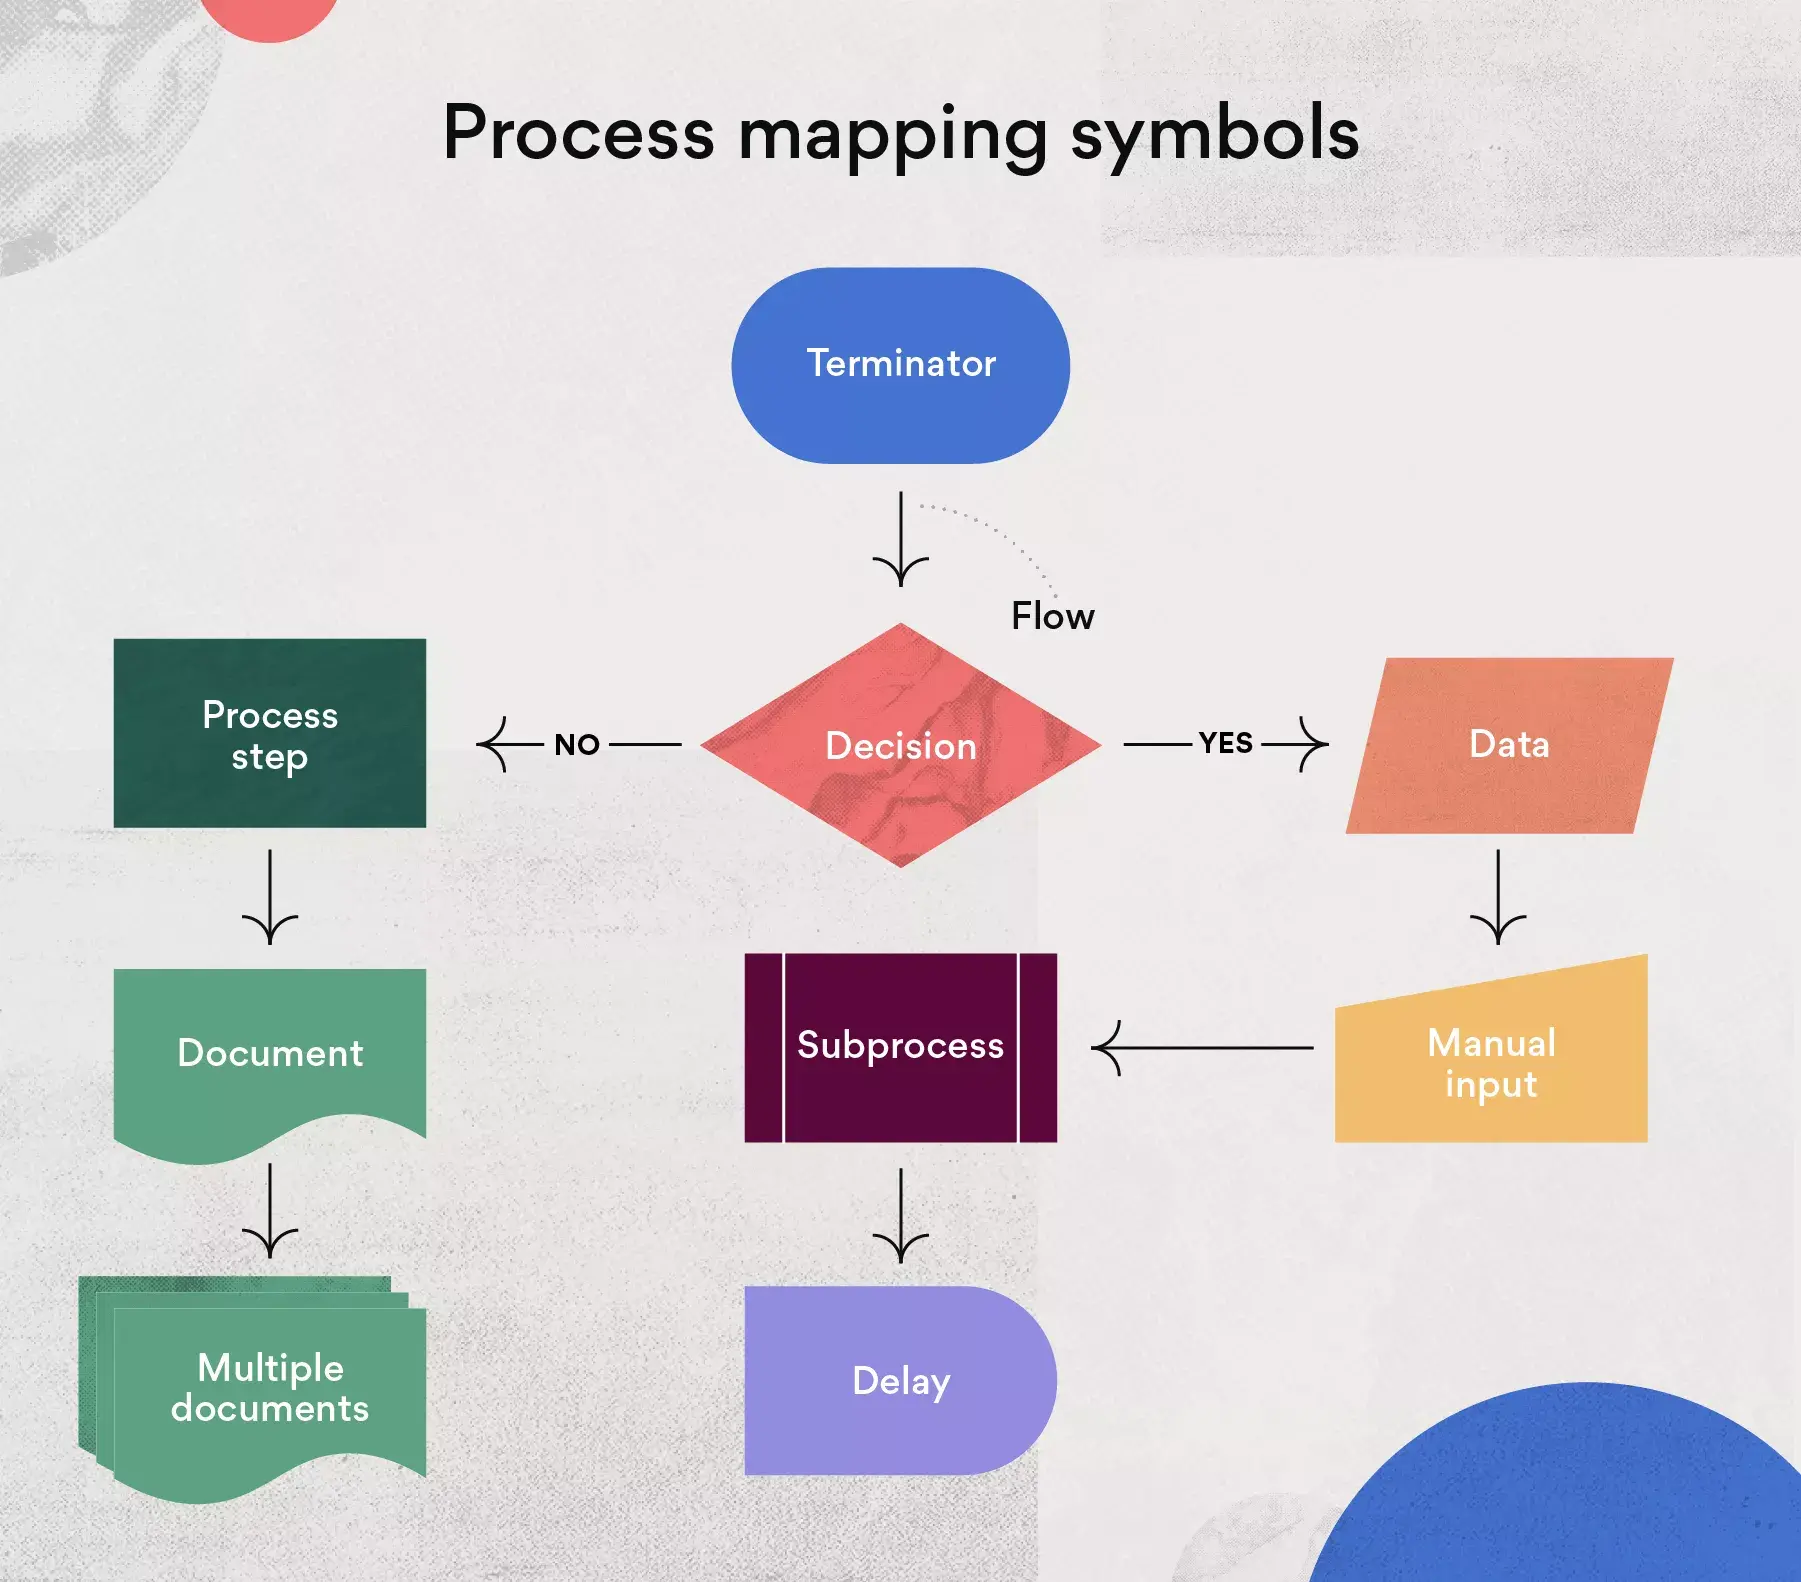
Process mapping symbols
Process maps use a common visual language to represent how work moves from one step to another. These symbols, adapted from the Unified Modeling Language (UML), help you show key elements such as tasks, decisions, and delays.
Here are the most common process mapping symbols and what they mean:
Symbol name | Shape | When to use it |
Terminator | Oval | Mark the start or end of a process |
Process step | Rectangle | Show a specific task or action in the workflow |
Flow | Arrow | Connect steps and show the direction of work |
Decision | Diamond | Indicate a decision point with multiple outcomes |
Delay | D-shape | Show where a pause or delay happens |
Document | Rectangle with wavy bottom | Represent a readable document or file |
Data | Parallelogram | Represent data flowing in or out of a step |
Manual input | Rectangle with slanted top | Show where someone must manually enter data |
Subprocess | Rectangle with double vertical lines | Represent a predefined process that happens elsewhere |
These are the core symbols you'll use most often. There are others you can add as your maps become more advanced, but this set is a solid starting point.
Create a process map templateHow to create a process map
You can create a process map using pen and paper, a whiteboard, or process mapping software. You'll find ready-made templates, but learning how to map a process from scratch gives you control over every step.
Step 1: Choose a process to map
Pick the specific process you want to map. It might be something messy, inefficient, or just unclear to your team members. It could be a new process you need to explain or a complex process that confuses people. Choose one and give it a simple name.
Step 2: List every activity and person involved
Start by writing down every task in the process flow. Don't worry about the order yet. List all the inputs, actions, and who's responsible for each.
Work with your team and other stakeholders to:
Catch important sub-processes
Decide how much detail to include
Mark the starting point and end point clearly
Step 3: Put the steps in order
Now, take that list and arrange the tasks in the correct order. Walk through the current process from start to finish, filling in any steps you missed earlier. This will give you a complete picture of the workflow.
Step 4: Draw the flowchart
Choose the format that fits best. Depending on the level of detail and the type of process, your options include:
Basic flowchart
Swimlane diagram
Value stream map
BPMN chart
Use standard process mapping symbols to mark decision points, actions, and connections.
Read: 4 types of concept maps (with free templates)Step 5: Review with your team
Go over the process flowchart with everyone involved. Make sure the entire process is accurate. Ask if any steps are missing, if any tasks are repeated, or if anything seems unclear. Fix any mistakes. Then share the final version with your team members and anyone else who needs it.
Step 6: Look for problems and improve the process
Now that your map reflects the current state, use it as a tool for process improvement. Look for bottlenecks, inefficiencies, and unnecessary steps. Ask your team where they get stuck or confused.
From there, optimize the process by cutting steps, reassigning tasks, or adding automation. Update the process map to reflect changes. This is how continuous improvement happens: map it, fix it, repeat. Workflow management software can help turn those process fixes into assigned tasks, automated steps, and trackable updates.
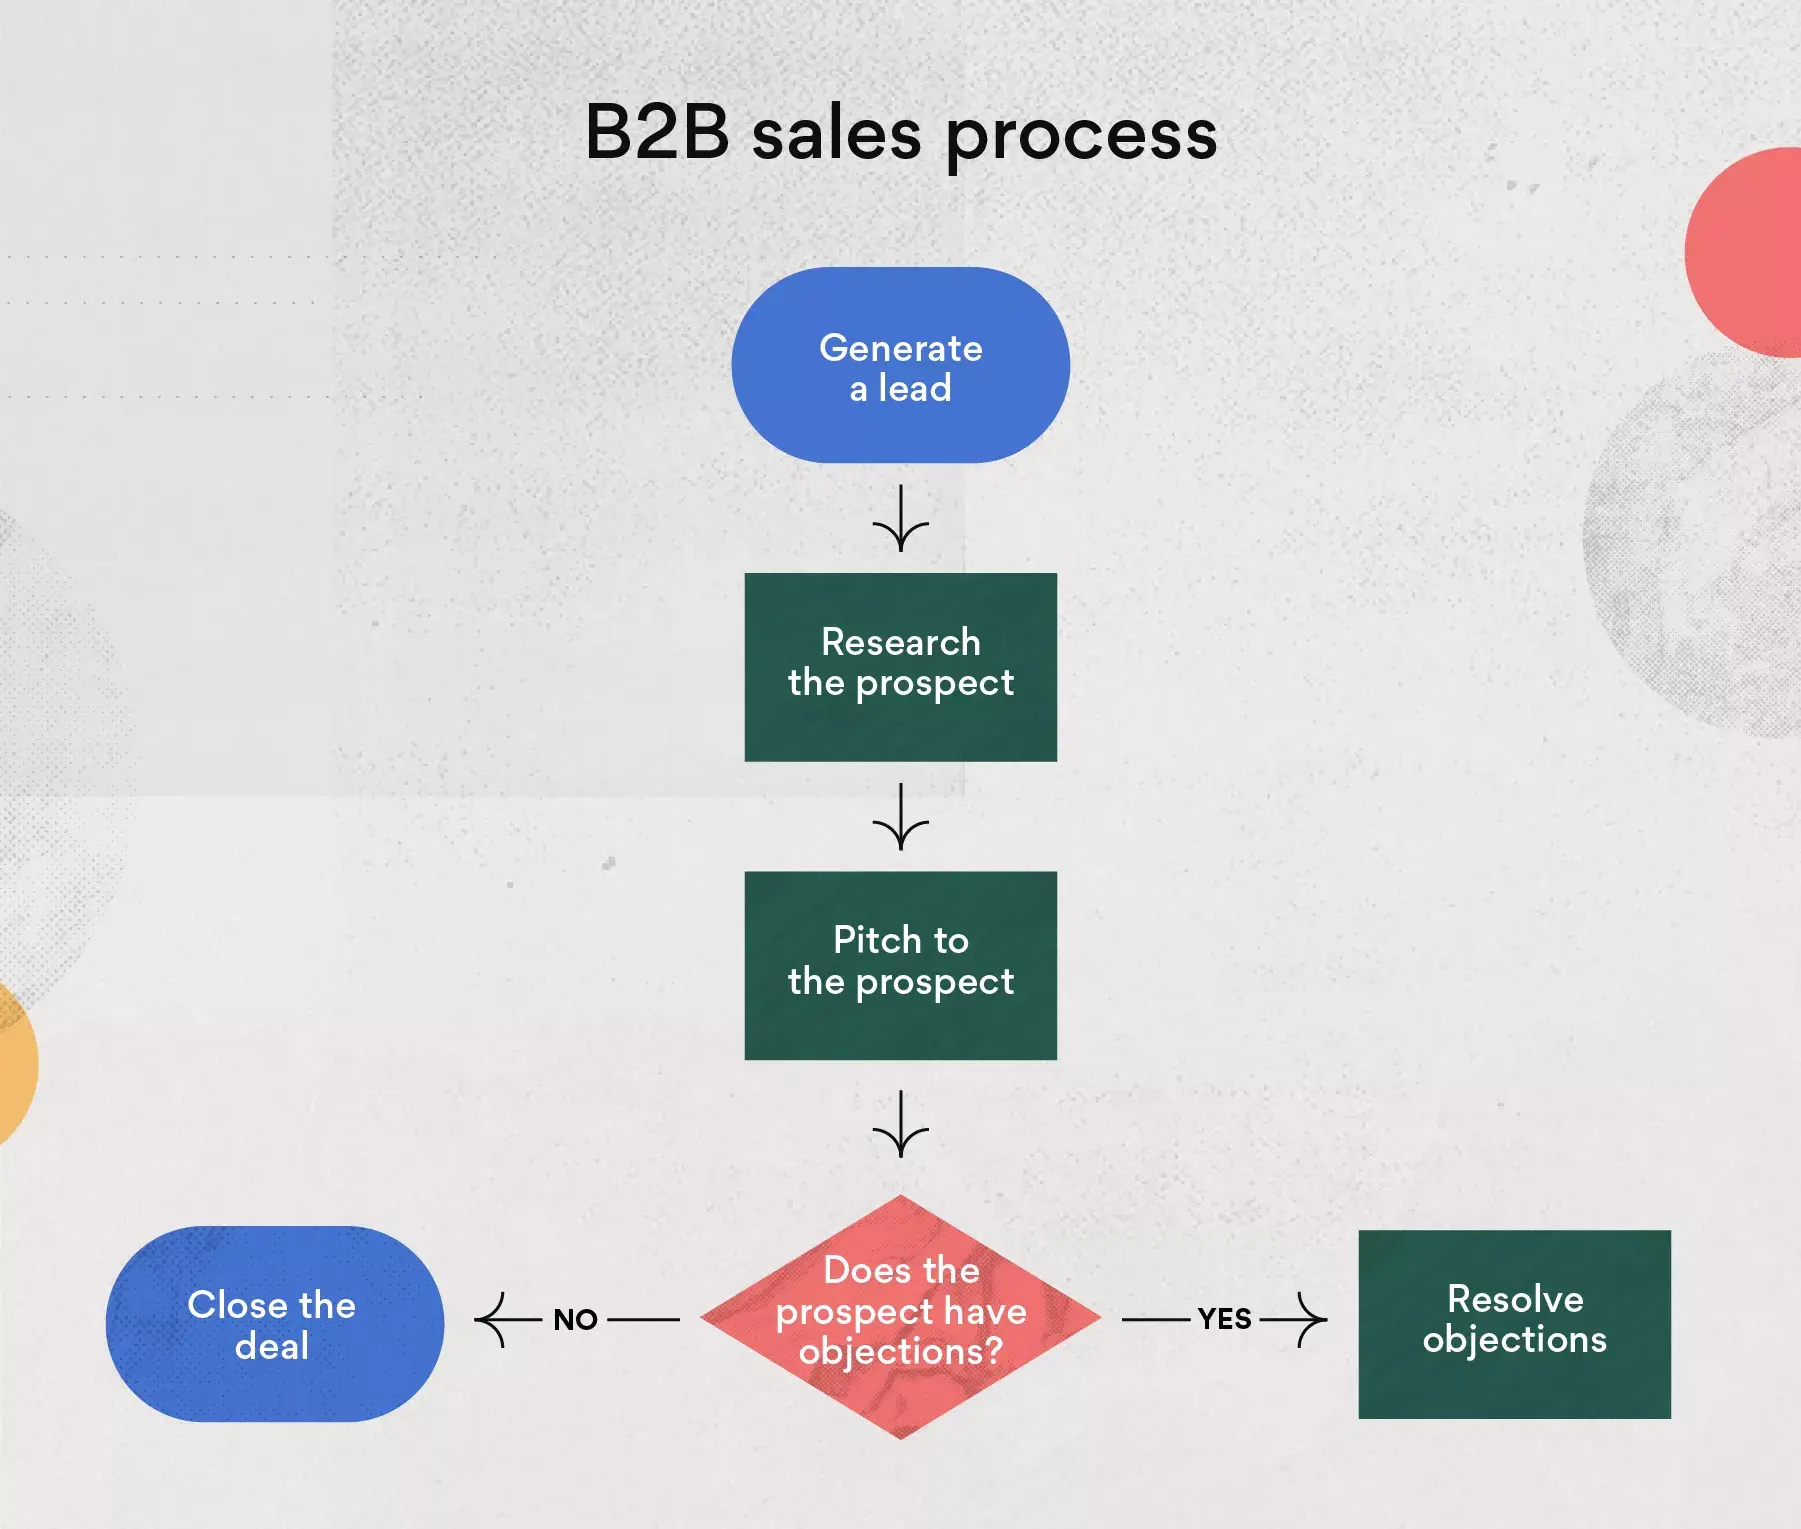
Process mapping example
You can create a process map for any type of process, but you may still be wondering how to apply this tool to your team.
To help you get a better idea of what a process map might look like, here is an example:
Process mapping techniques
You can tailor your process map to fit your team's needs, but some best practices can help you build clear, effective maps from the start.
Here are a few process mapping best practices to get the most out of each stage.
1. Plan before you map
Set the scope. Define the start and end points so your map includes only what's necessary.
Clarify your goal. Know what you want the process to achieve.
Focus on outcomes. Only map processes with a clear, measurable result.
2. Build your map with intention
Work backward. Start from the desired outcome, then map steps in reverse.
Simplify where possible. Keep subprocesses easy to follow.
Include the right amount of detail. Don't overcomplicate, but don't leave gaps.
Use standard symbols. Stick to common process mapping notation to ensure shared understanding.
3. Review and refine
Get feedback. Involve everyone who plays a role in the process.
Account for alternate paths. If there's more than one way to reach the goal, include those options.
Map what's real, not ideal. Show how the process actually works today, then improve from there.
Apply these tips as you go, from planning through review, to build process maps that are clear, useful, and ready to drive real improvements.
Start process mapping, start improving
Process mapping is just the start. With the free Asana process mapping template, you can visualize your workflows, spot what's slowing you down, and bring clarity to every step.
Once you map your process, use Asana to keep work moving, assign tasks, track progress, and stay aligned from start to finish. Ready to turn your process maps into action? Get started with Asana today.
Create a process map template