工作流程圖表:符號、用途和範例


摘要
在管理工作方面,將任務可視化並透過不同的溝通風格讓團隊成員保持聯繫是關鍵所在。 這就是工作流程圖派上用場之處。
工作流程圖可以透過可視化的方式傳達目標和期限,有助於防止專案偏差和瓶頸。 無論您是在新員工到職時使用工作流程圖,還是用於簡化使用案例和推薦,這都是將任務和資料流程可視化的好方法。
從它是什麼到如何建立自己的工作流程圖,我們整理了一些關於工作流程圖的最重要的事實,並包含了有用的範例。
什麼是工作流程圖?
工作流程圖 (也稱為工作流程圖表) 提供了Business 版流程或系統的圖形概觀。 通常,您會在完成初始研究和專案規劃階段後使用這些圖表來視覺化複雜的專案。建立工作流程圖後,您將根據整體專案時間軸和目標,詳細了解高階任務和相依性。
藉助 Asana 可視化及組建工作流程工作流程圖與其他流程圖的比較
工作流程圖與 UML (統一建模語言) 中的其他圖表有許多共同點,UML 是一種用於指定、可視化、構建和記錄軟體系統成品的標準語言。 但工作流程圖與其他流程圖繪製和 UML 圖表略有不同。 在這裡,我們將其與一些常見類型進行比較,以展示其方式:
閱讀:工作流程圖表:符號、用途和範例Business 版流程圖繪製
工作流程圖與 Business版流程圖繪製密切相關。 兩者之間的差異在於,流程圖通常會詳細說明步驟,而工作流程圖則會提供這些步驟的可視化呈現。 工作流程圖的目標是幫助團隊成員從高層次上瞭解他們在專案中的任務、目標以及角色和責任。
流程圖
工作流程和流程圖經常被混淆。 儘管這兩個詞聽起來很像,但工作流程只是流程圖的一種。 您還可以使用流程圖將其他流程可視化,例如PERT 圖表和流程文件。
活動圖表
活動圖是另一種類型的流程圖,用於概述系統中一系列活動的流程。 它用於將 Business 版系統的功能轉化為更易於理解的資訊,以供不太瞭解後端運作的人員使用。 換句話說,活動圖是一種將技術流程可視化的簡單方法。 例如,在Asana中,您可以繪製一個活動圖表來建立專案,如下所示:
使用者點選按鈕以建立專案
新專案已啟動
使用者使用不同的名稱和功能自訂專案
使用者儲存專案並在需要時進行更新
資料流程圖
資料流程圖透過作業系統或流程追蹤資料,而工作流程圖則追蹤工作本身。 例如,在資料流程圖中,您輸入的不是動作,而是指標、結果或其他您想要描繪的資料點。
閱讀:4 種類型的概念圖 (附免費範本)何時使用工作流程圖
工作流程圖是流程的可視化呈現方式,無論是您正在建立的新流程,還是您正在變更的現有流程。 例如:
簡化電子商務客戶旅程的流程。
提高客戶維繫和滿意度的專案。
將涉及客戶資料的手動任務自動化並最佳化的流程。
工作流程圖介於 Business 版流程圖 (您將在專案開始前建立) 和Business 版流程自動化(您將用於最佳化和簡化流程) 之間。 這是因為您的圖表提供了專案關係人開始工作所需的詳細流程步驟,而工作流程圖則是一種高階的可視化呈現方式,有助於在流程中闡明總體目標。
藉助 Asana 可視化及組建工作流程工作流程圖的組成部分
為了瞭解工作流程圖的運作方式,您首先需要瞭解構成工作流程的組成部分。 這些包括輸入、輸出和轉換,所有這些都有助於在最短的時間內傳達交付項目。
一旦您瞭解這些組成部分,就能正確閱讀工作流程圖,並建立自己的工作流程圖。 工作流程圖的主要組成部分包括:
輸入:影響後續步驟的動作
轉換:輸入變更
輸出:轉換後的結果
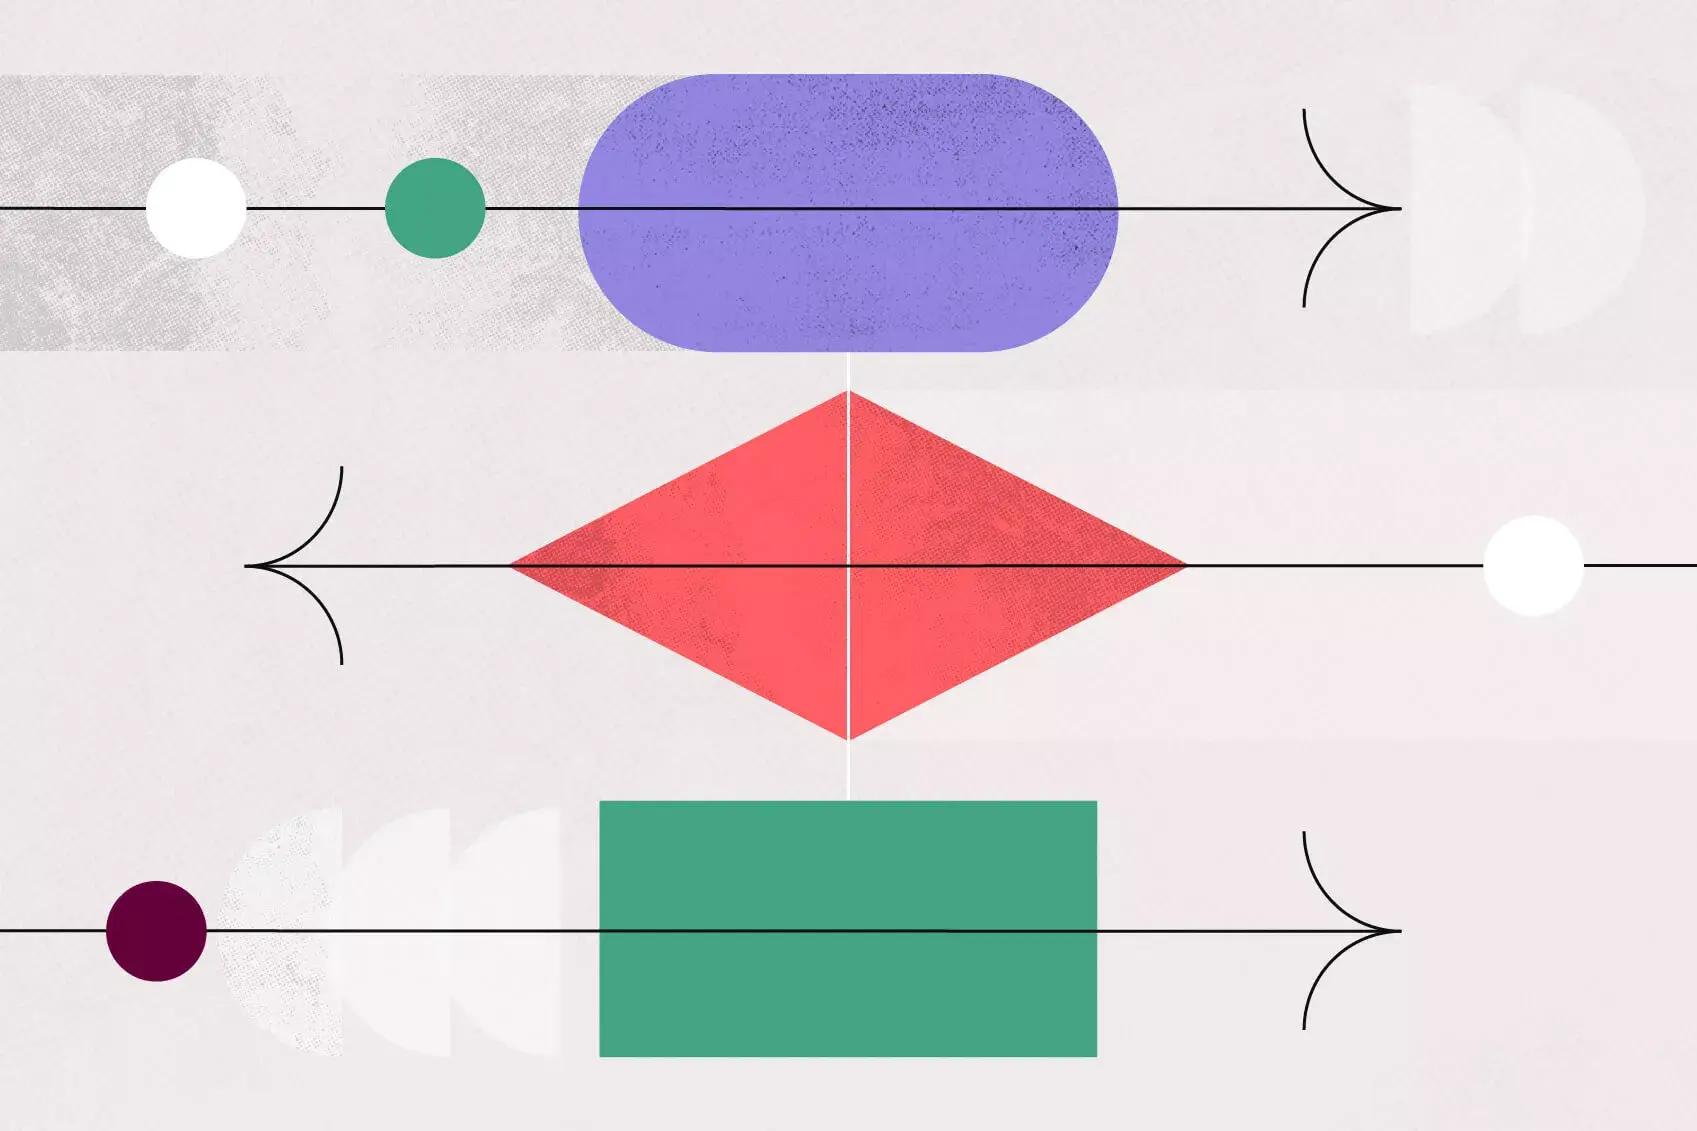
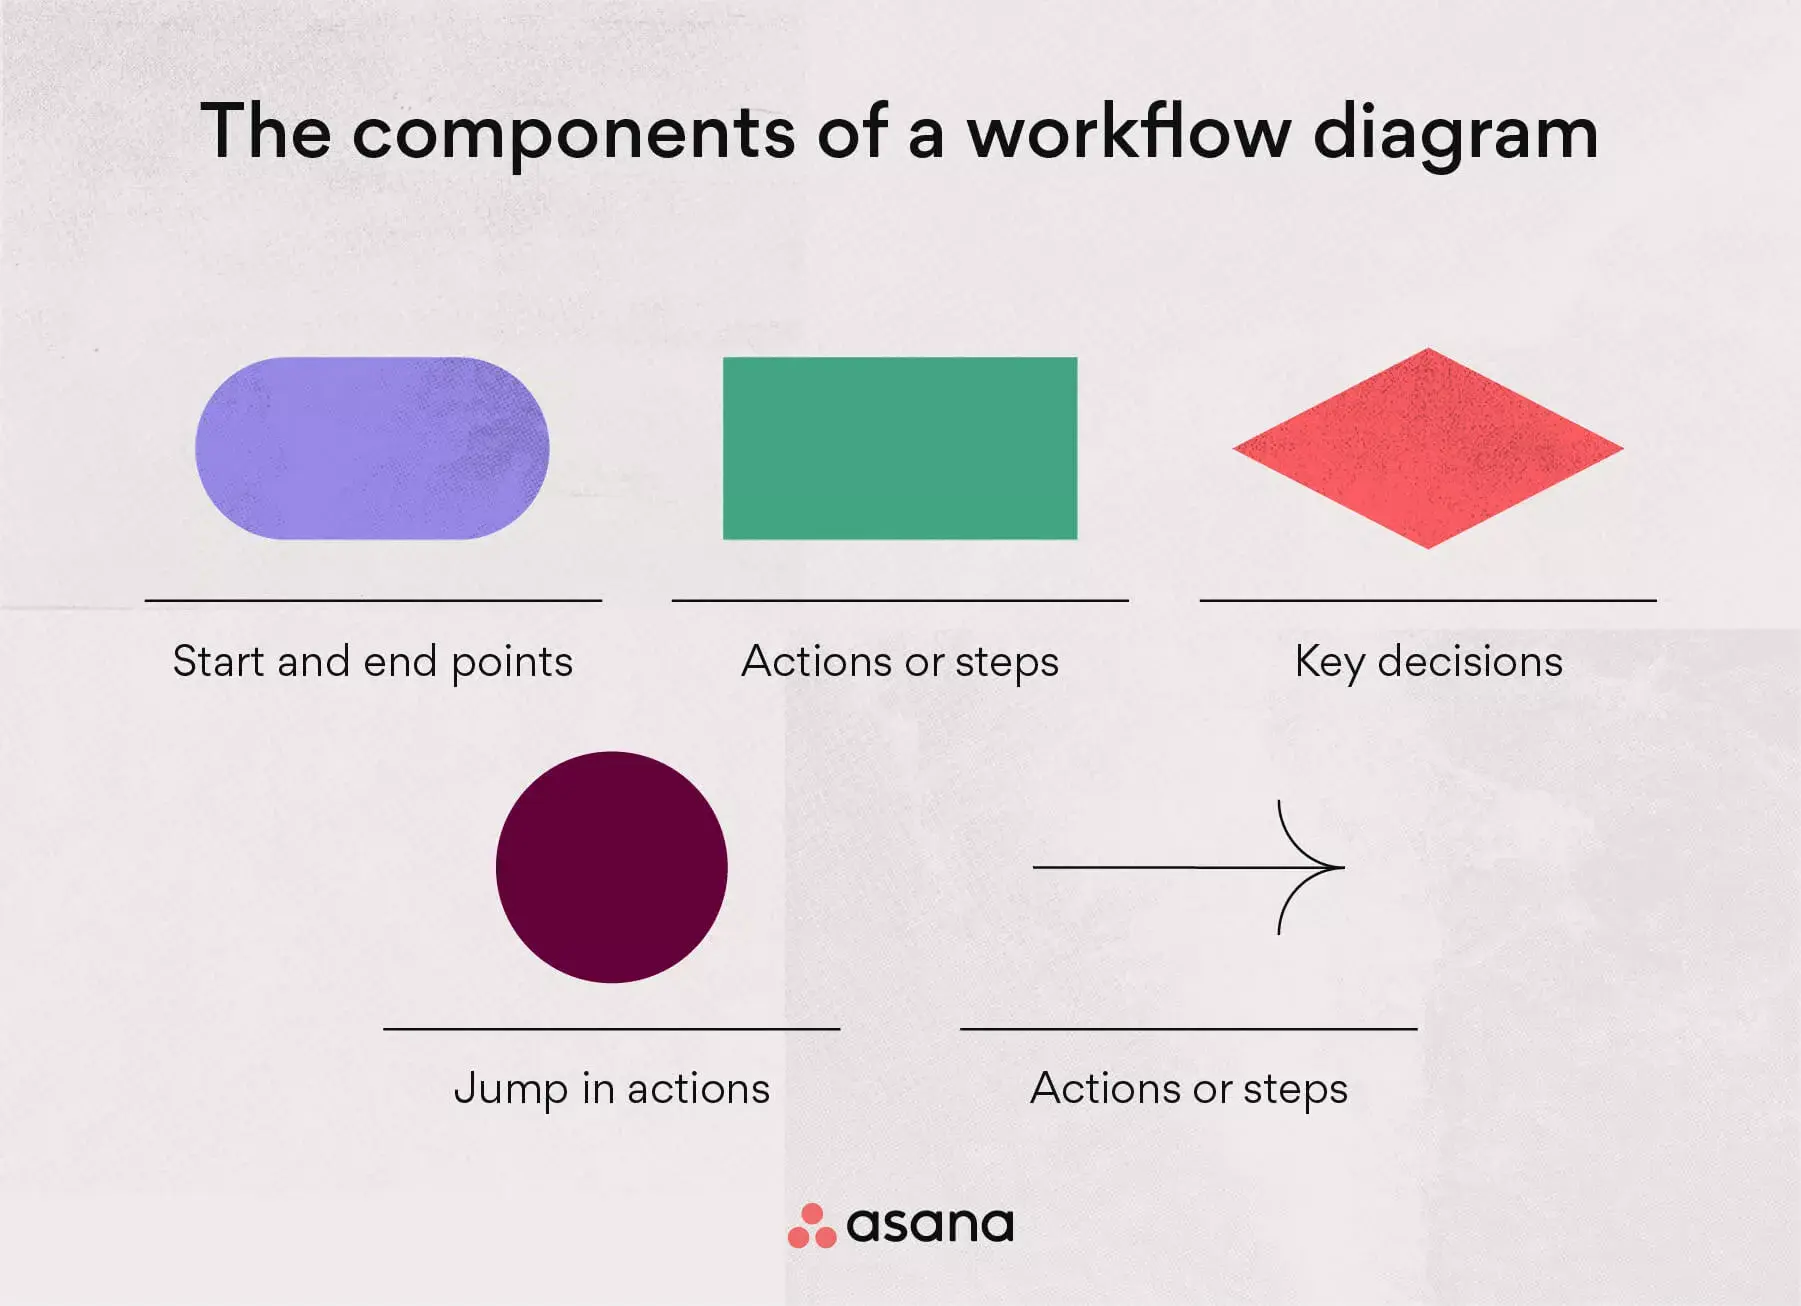
這些組成部份會以形狀和箭頭可視化,包括:
橢圓形:表示流程的起始點和結束點。
矩形:代表有關動作和步驟的說明。
菱形:代表流程建立期間的關鍵決策。
圓形:代表行動的跳躍,並可能表示繞過的步驟 (在某些情況下)。
箭頭:代表所有形狀和動作之間相依性的連接器。
這些組成部分共同指導讀者如何遵循正確的路徑並實現預期的結果。
工作流程圖類型
在可視化流程方面,您可以選擇幾種不同的工作流程圖格式。 每一種都提供獨特的優勢,可以幫助您規劃下一個流程。 您選擇的圖表類型將取決於您正在進行的流程以及您對該流程的需求。
從流程圖到泳道圖,以下是您可以用於工作流程分析的四種不同類型的工作流程圖。
閱讀:3 種可視化專案管理版面配置 (以及使用方法)1. 流程圖
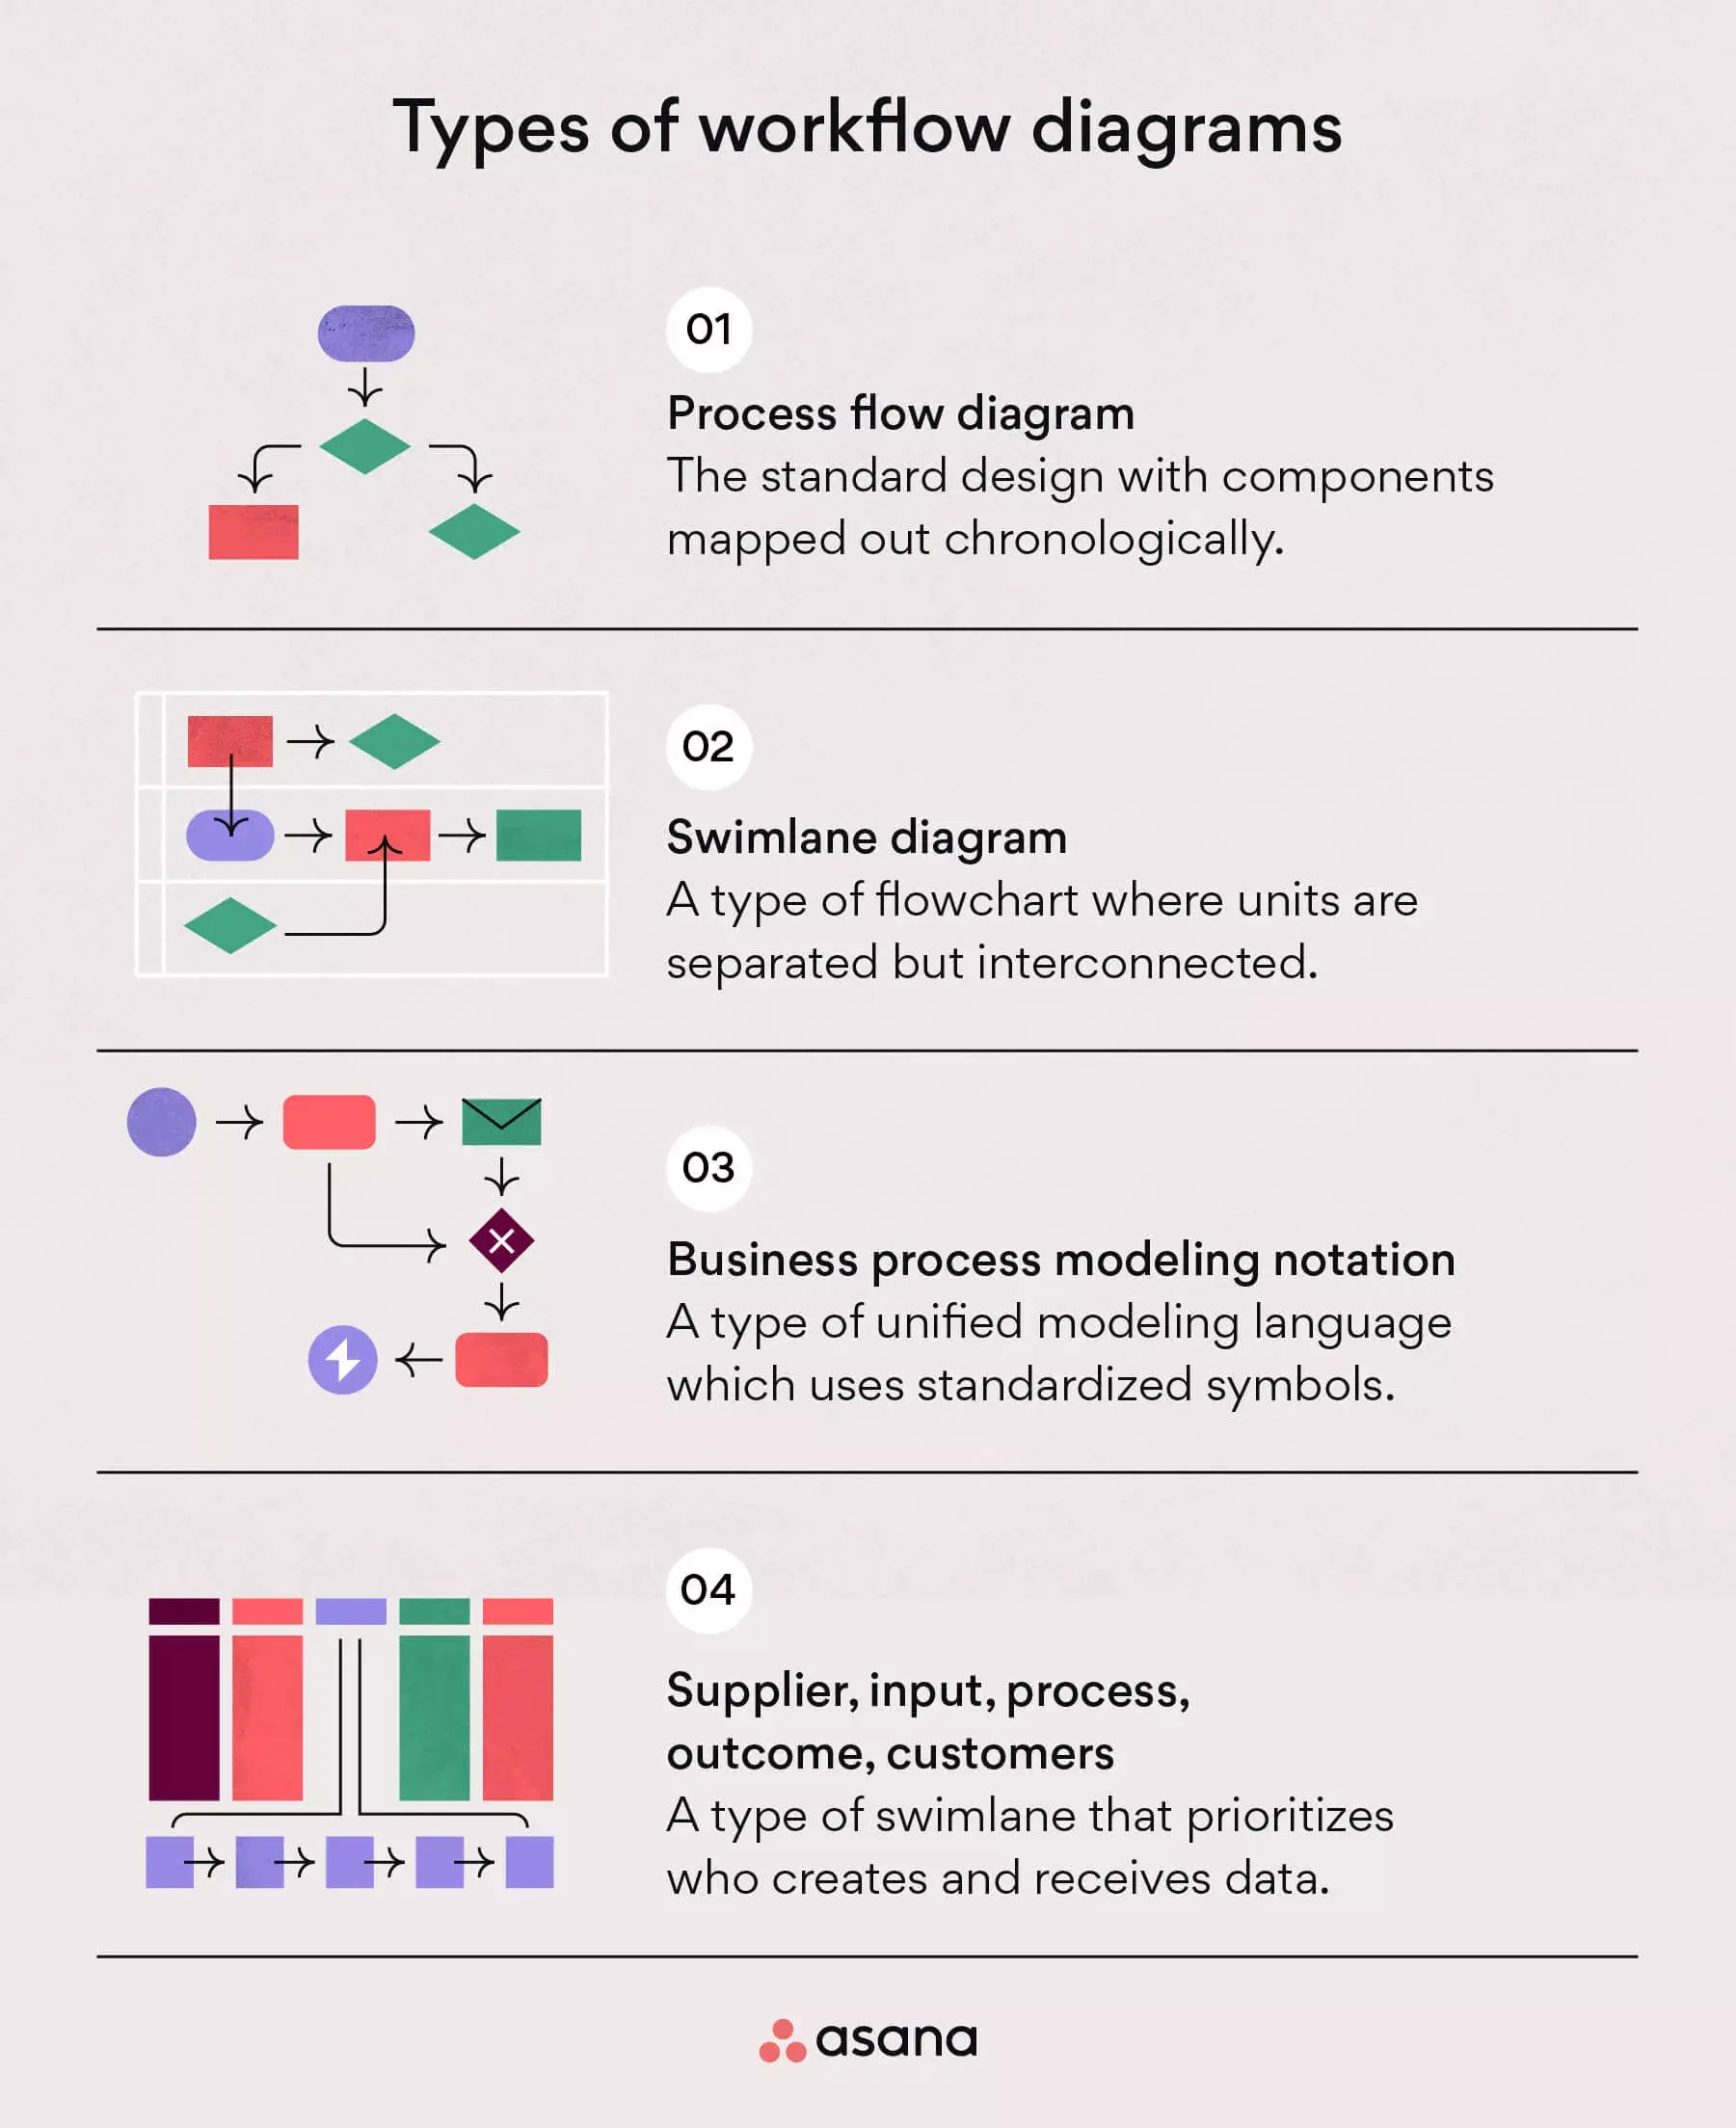
流程圖工具是工作流程的標準設計。 在此圖表中,所有組成部分都按時間順序進行對應,使其成為流程的基本可視化呈現方式。 這種類型的圖表提供了個別任務和目標的一般概述,而不會涉及太多詳細資料。
最適合:需要以高階視覺化方式呈現新流程,且任何專案關係人或部門都能快速理解的團隊。
2. 泳道圖
泳道圖也是一種熱門的工作流程版面配置,但泳道與流程圖有很大的不同。 泳道圖將您的工作流程分解為更小的流程或單位。 這些流程是相互連結但又分開的,以強調互動和可能的低效率。 這樣做可提升可視度,並更深入地瞭解整體流程工作流程。
最適合:處理複雜流程的團隊,這些流程具有許多相互關聯但獨立的層級。
3. Business 版流程模組化標記法 (BPMN) 圖表
BPMN 使用統一的標記法,Business 版和技術專案關係人都可以輕鬆解讀。 這是一種統一的建模語言,使用標準化符號來傳達不同的步驟。
BPMN 圖表著重於內部接收的資訊以及如何解釋這些資訊。 這就是為什麼它最常用於不影響外部客戶的內部流程變更。
最適合:致力於不同部門流程改進的團隊。
4. 供應商、輸入、流程、輸出、客戶 (SIPOC) 圖表
SIPOC 是一種泳道圖,專注於分析工作流程的多個不同部分。
與按順序組織資料的傳統圖表不同,SIPOC 圖表會優先考慮建立和接收流程資料的人員。 SIPOC 專注於資料在內部和外部的接收方式,這就是它用於與客戶體驗相關的流程的原因。
最適合:希望專注於內部和外部資料接收方式的團隊。
閱讀:什麼是 SIPOC 圖?繪製和理解 Business 版流程的 7 個步驟如何建立工作流程圖 (附範例)
若要建立工作流程圖,請先整合流程的主要組成部分。 為此,請將您的輸入、輸出、轉換和主要流程交付項目整合在一起。
使用箭頭、圓形、矩形、橢圓形和菱形來表示每個資料點,從而在圖表上繪製工作流程組成。
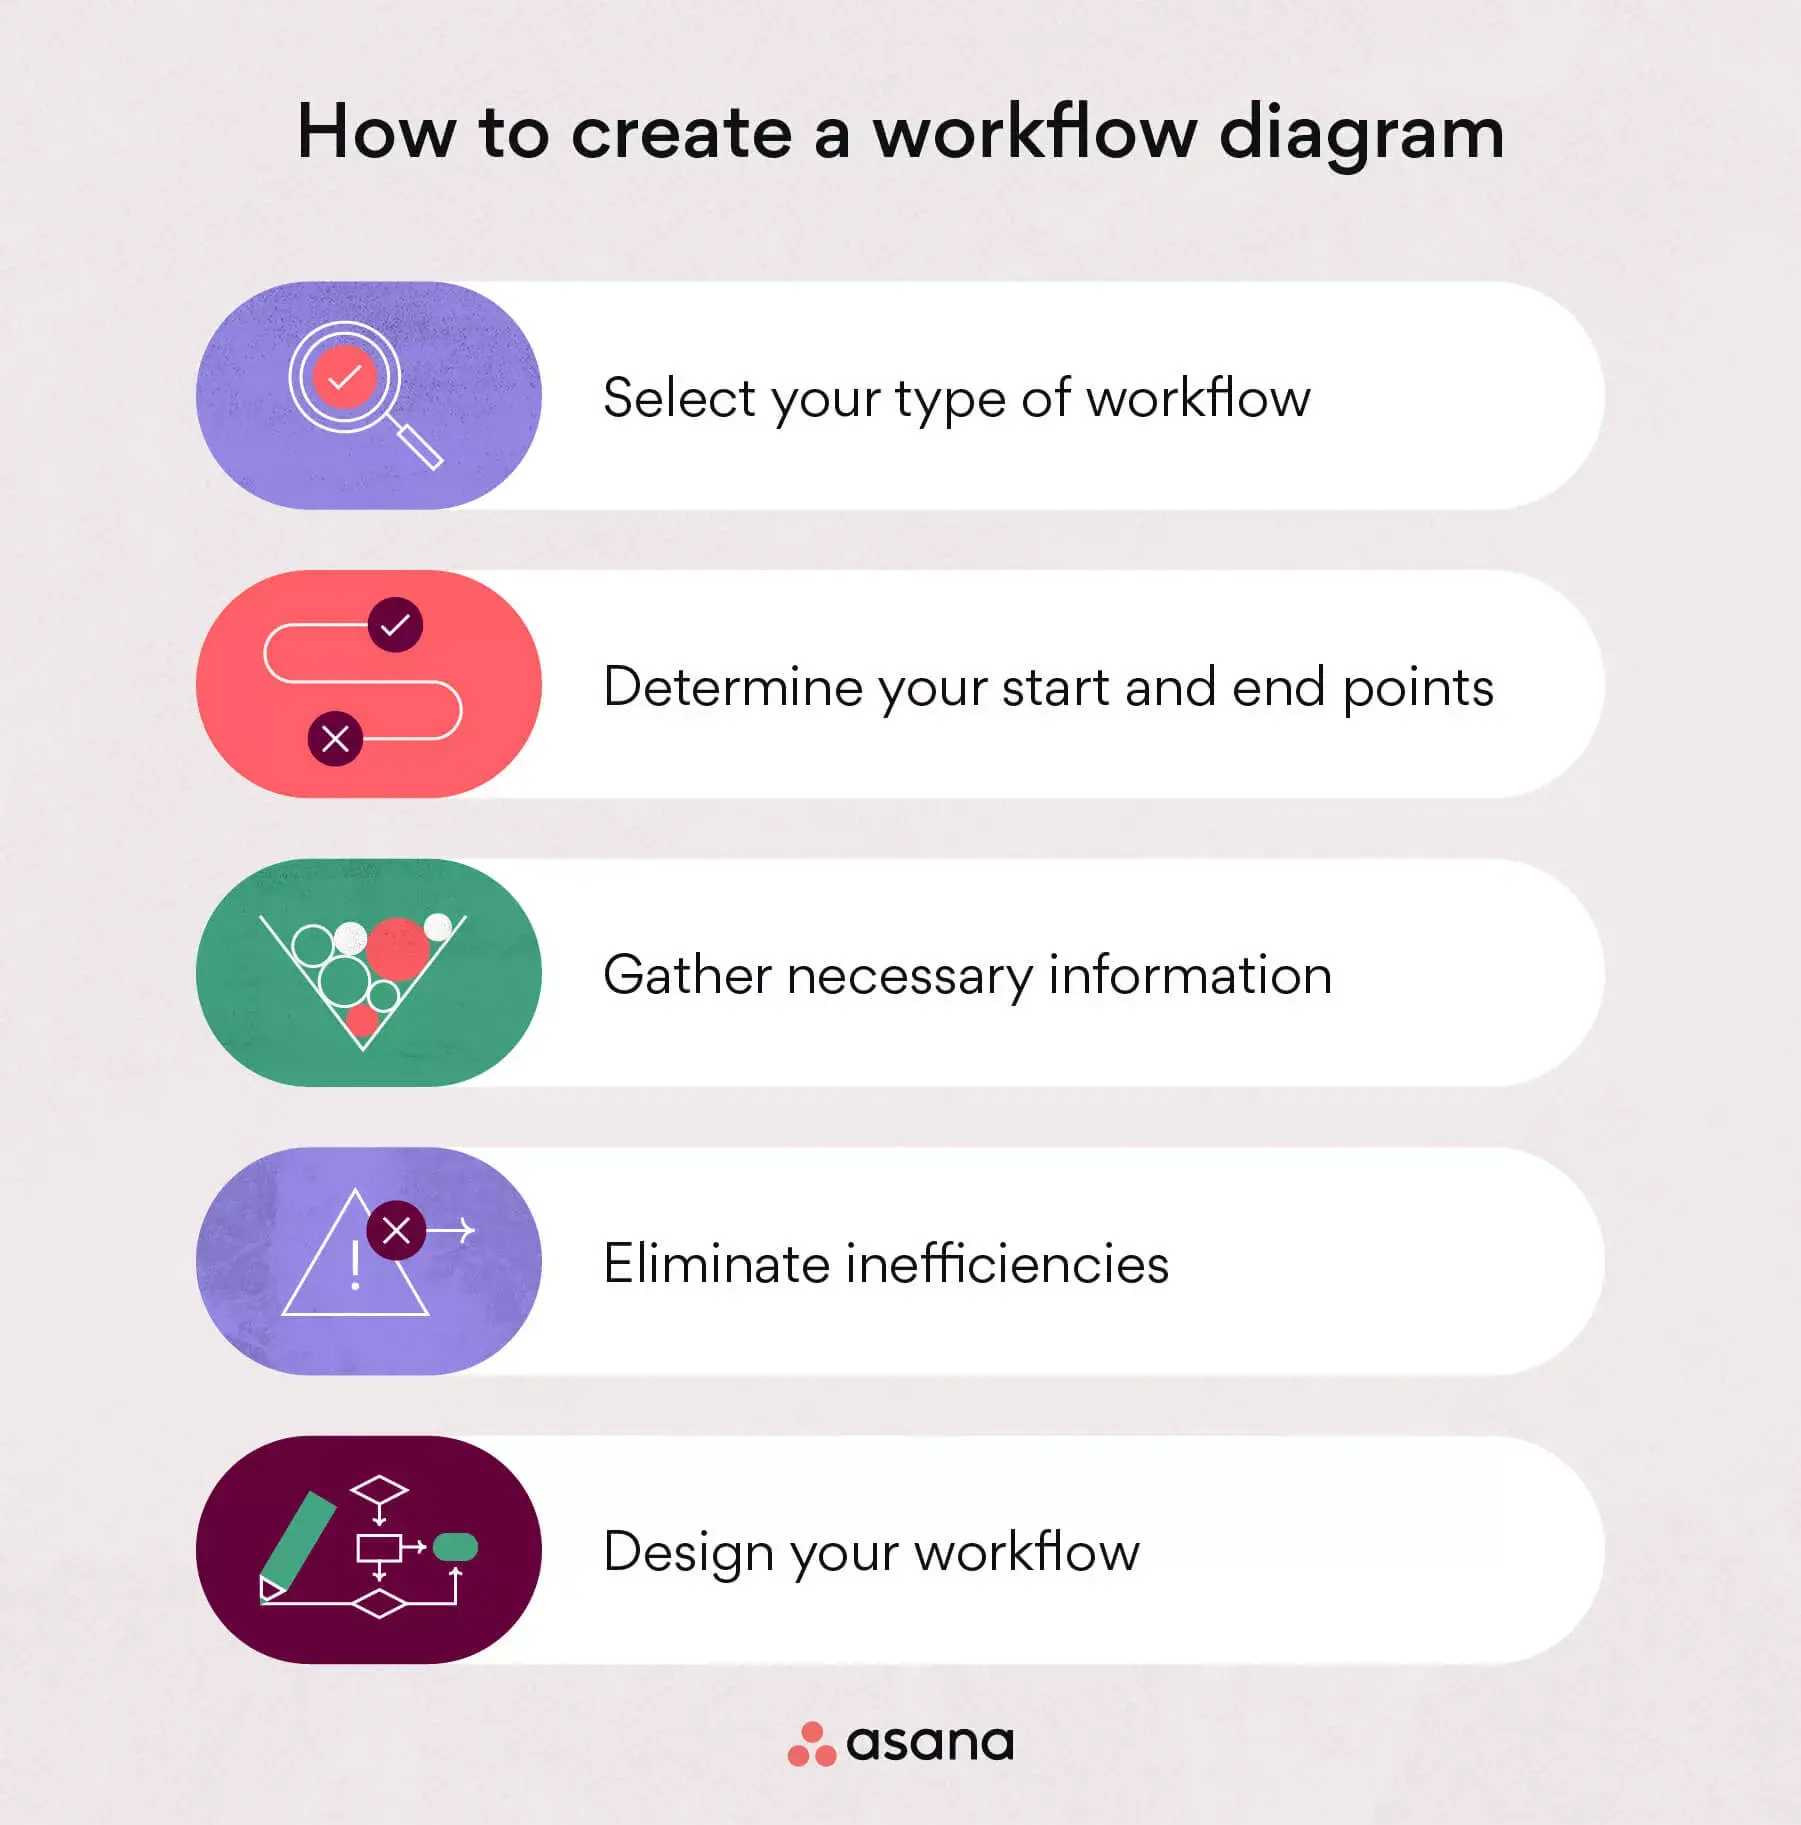
藉助 Asana 可視化及組建工作流程1. 選擇您的工作流程類型
若要選擇最適合您的工作流程類型,請考慮流程所需的功能。 這是一個涉及多個專案關係人的複雜流程,最適合使用泳道圖嗎? 還是一個相對簡單的流程,最適合使用簡單的流程圖?
雖然您可以隨時調整工作流程,但最好還是先決定工作流程的類型。 這樣,您就可以確切知道您的工作流程有多複雜或簡單。
2. 確定您的起點和終點
接下來,確定您的工作流程起點和終點 (在圖表上以橢圓形表示)。
若要確定這些點,請考慮流程的開始和結束時間。 是否有觸發流程的動作? 同樣地,是否有結束流程的行動或步驟? 這些資料點將有助於在流程開始和結束時進行有效溝通。
3. 收集必要資訊
若要收集資訊,請與專案關係人聯繫,以瞭解流程的每個部分。 這可能包括與各部門和領導者進行啟動會議,以收集開始建立工作流程圖所需的詳細資料和核准。
由於每個流程各不相同,您需要收集的資訊也會有所不同。 考慮完成流程所需的步驟、將參與的專案關係人,以及任何其他有助於讀者瞭解情況的重要詳細資料。
4. 消除低效率
在構建可視化工作流程之前,最後一步是考慮並消除可能出現的任何低效率。 在設計工作流程之前,請務必分析低效率的問題,以便預防任何問題,而非即時處理。 具體的低效率會有所不同,但可能包括缺乏資源、產品開發問題或過程中可能出現的任何其他障礙。
在變更管控流程下的變更日誌中記錄這些低效率。 這樣,您就能將這些問題傳達給專案關係人,確定低效率的優先順序,並追蹤它們是否已得到解決。
5. 設計您的工作流程
最後,開始構建您的工作流程。 收集單位資訊、資料點和效率,並將其對應到您在第一步中選擇的圖表上。 由於每個流程都不同,每個圖表的構造也不同,因此您的設計可能是獨一無二的。 以下是工作流程圖可能的外觀範例:
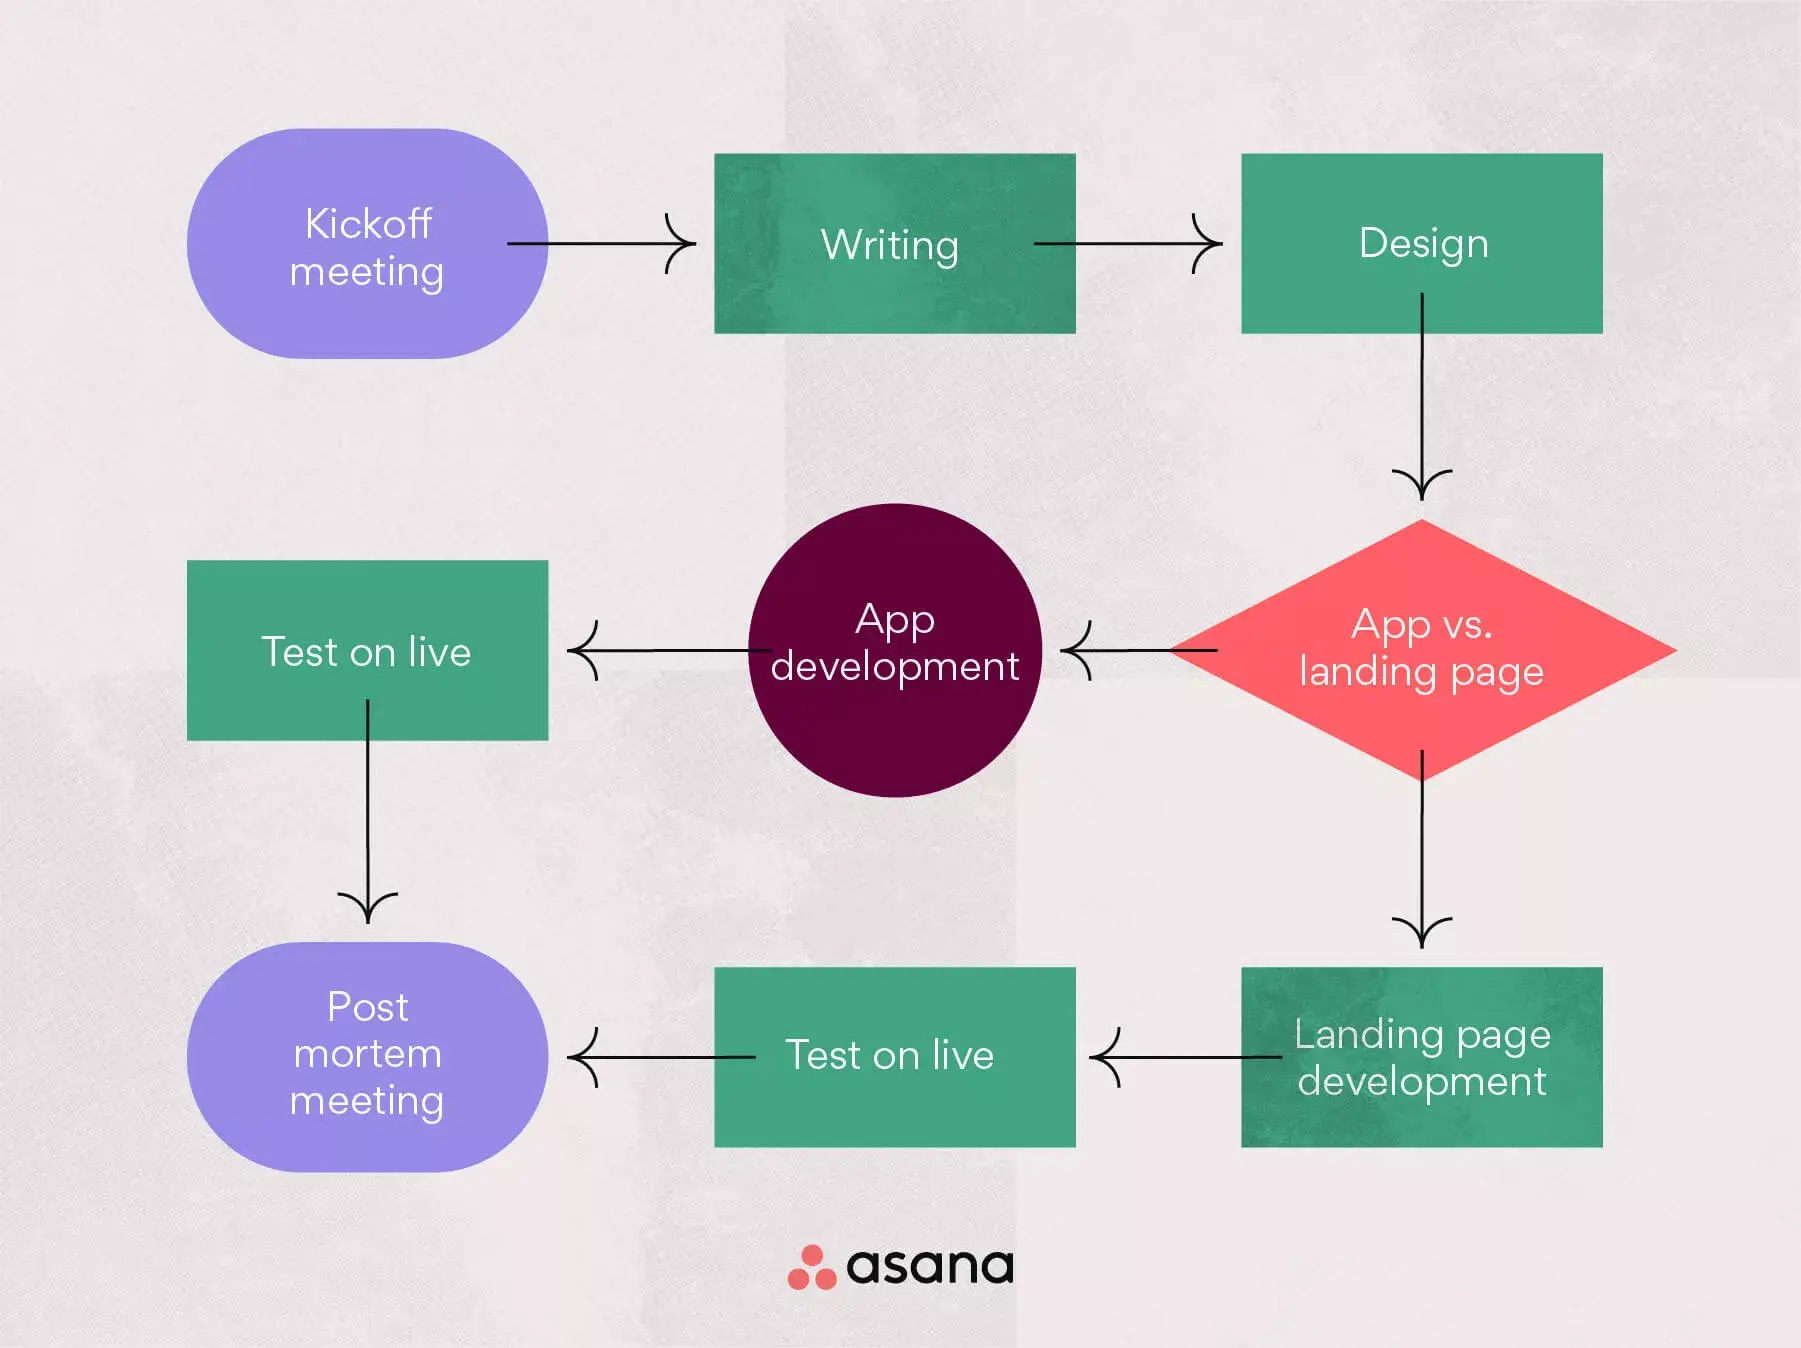
設計好工作流程後,請與專案關係人一起審閱,確保其準確且適合情況。 這是確保所有效率低下的情況都已得到解決,且資源已正確指定的絕佳方法。
使用工作流程繪製流程
將工作流程可視化有助於您向專案關係人和領導層有效傳達交付項目。 此外,這是一種在特定流程中協調多個不同部門的好方法。
若要進一步推進您的工作流程,請嘗試使用工作流程管理軟體。 從任務自動化到簡化溝通,Asana 都能助您一臂之力。
藉助 Asana 可視化及組建工作流程