摘要
交付延誤、錯過審查、重複的工作,這些不是生產力問題,而是流程問題。當沒有人能看到整個工作流程如何串聯在一起時,即使是簡單的任務也可能陷入停滯。這就是流程圖繪製派上用場之處:它能讓隱藏的問題變得清晰可見。
流程圖以視覺化方式呈現工作的完成方式,幫助團隊指出瓶頸、明確責任,並簡化日常工作流程。在本指南中,將介紹流程圖繪製的定義、適用對象、帶來的優點、可建立的流程圖類型,以及如何建立能幫助團隊更聰明地工作的流程圖。
什麼是流程圖繪製?
流程圖繪製 (也稱為流程映射) 是一種以視覺方式記錄工作流程運作方式的技巧。繪製流程圖時會建立一張圖表 (通常稱為流程圖或工作流程圖),其中顯示流程中的每個步驟、決策點和交接點,以便團隊能理解、溝通並改進完成工作的方式。
繪製流程圖的目的是透過簡單而清楚的方式說明流程如何運作。比起口頭說明冗長的流程,一張流程圖更能讓對方快速掌握全貌。從頭到尾繪製流程圖,可以更輕鬆地辨別哪些部分有效、哪些部分需要改善。
流程圖繪製與流程圖 (flowchart) 雖然經常混用,但兩者有細微差異。流程圖是以符號和箭頭呈現步驟的圖表,是流程圖繪製最常用的視覺化格式之一。流程圖繪製則涵蓋更廣,除了流程圖之外,還包括泳道圖、價值鏈圖、SIPOC 圖等多種格式。
常見的應用場景包括:
如果某個流程看起來混亂或容易引起誤解,流程圖繪製可以幫助每個人看清全貌。
誰會使用流程圖繪製?
從小型團隊到企業組織,各行各業和各種角色都會使用流程圖繪製。以下是能從這項技術中受益最多的人員:
業務分析師 使用流程圖繪製來瞭解並記錄業務流程的運作方式、找出效率低下之處,並提出改進建議。
營運經理 依靠流程圖將工作流程標準化、減少浪費,並改善團隊協調。
專案經理 建立流程圖,以便規劃複雜的計劃、釐清相依性,並讓專案關係人保持資訊同步。
HR 和培訓團隊 使用流程圖來記錄到職工作流程、說明政策,並幫助新員工更快上手。
IT 和企業架構師 繪製系統整合和資料流程,以支援軟體開發和自動化專案。
顧問 使用流程圖繪製協助客戶以視覺方式呈現其目前狀態,並設計更有效率的工作方式。
只要團隊需要說明、改進或標準化工作的完成方式,流程圖繪製就能派上用場。
為什麼要使用流程圖?
流程圖可將構想轉化為團隊可以遵循的清楚步驟。這是一種規劃工作、發現問題並改進工作方式的實用方法。
以下說明流程圖繪製可以帶來哪些幫助:
找出效率低落之處:瞭解任務在哪些地方積壓、中斷或遺漏。
使構想精簡化:將宏大的構想分解成較小的可執行步驟。
為「假設情況」制定計劃:制定應變計劃,並在障礙發生之前加以處理。
確立角色:明確指定負責每個流程步驟的人員。
建立流程文件:建立一份任何人都可以遵循的可重複使用指南。
清楚溝通:使用簡單的視覺資訊,讓每個人資訊同步。
加快決策速度:減少來回溝通,更快做出決策。
支援團隊:協助員工對自己的工作充滿信心。
保持合規:遵守並符合 ISO 9000 及 ISO 9001 等標準。
流程圖類型
流程圖有各式各樣的圖形和尺寸,目的皆相同,然而特定類型的流程圖可能更適合某些特定的專案。以下是常見類型的比較:
流程圖類型 | 最適合 | 複雜性 |
基本流程圖 | 簡單、有順序的流程 | 低 |
高階流程圖 | 高層概覽和範疇確定 | 低 |
詳盡流程圖 | 複雜的工作流程和稽核 | 高 |
泳道圖 | 跨職能流程 | 中 |
價值鏈圖 | Lean 流程改善 | 高 |
SIPOC 圖 | 在詳細繪製流程圖之前決定範疇 | 低 |
BPMN | 自動化與系統整合 | 高 |
以下是對每一種類型以及其使用時機的深入說明。
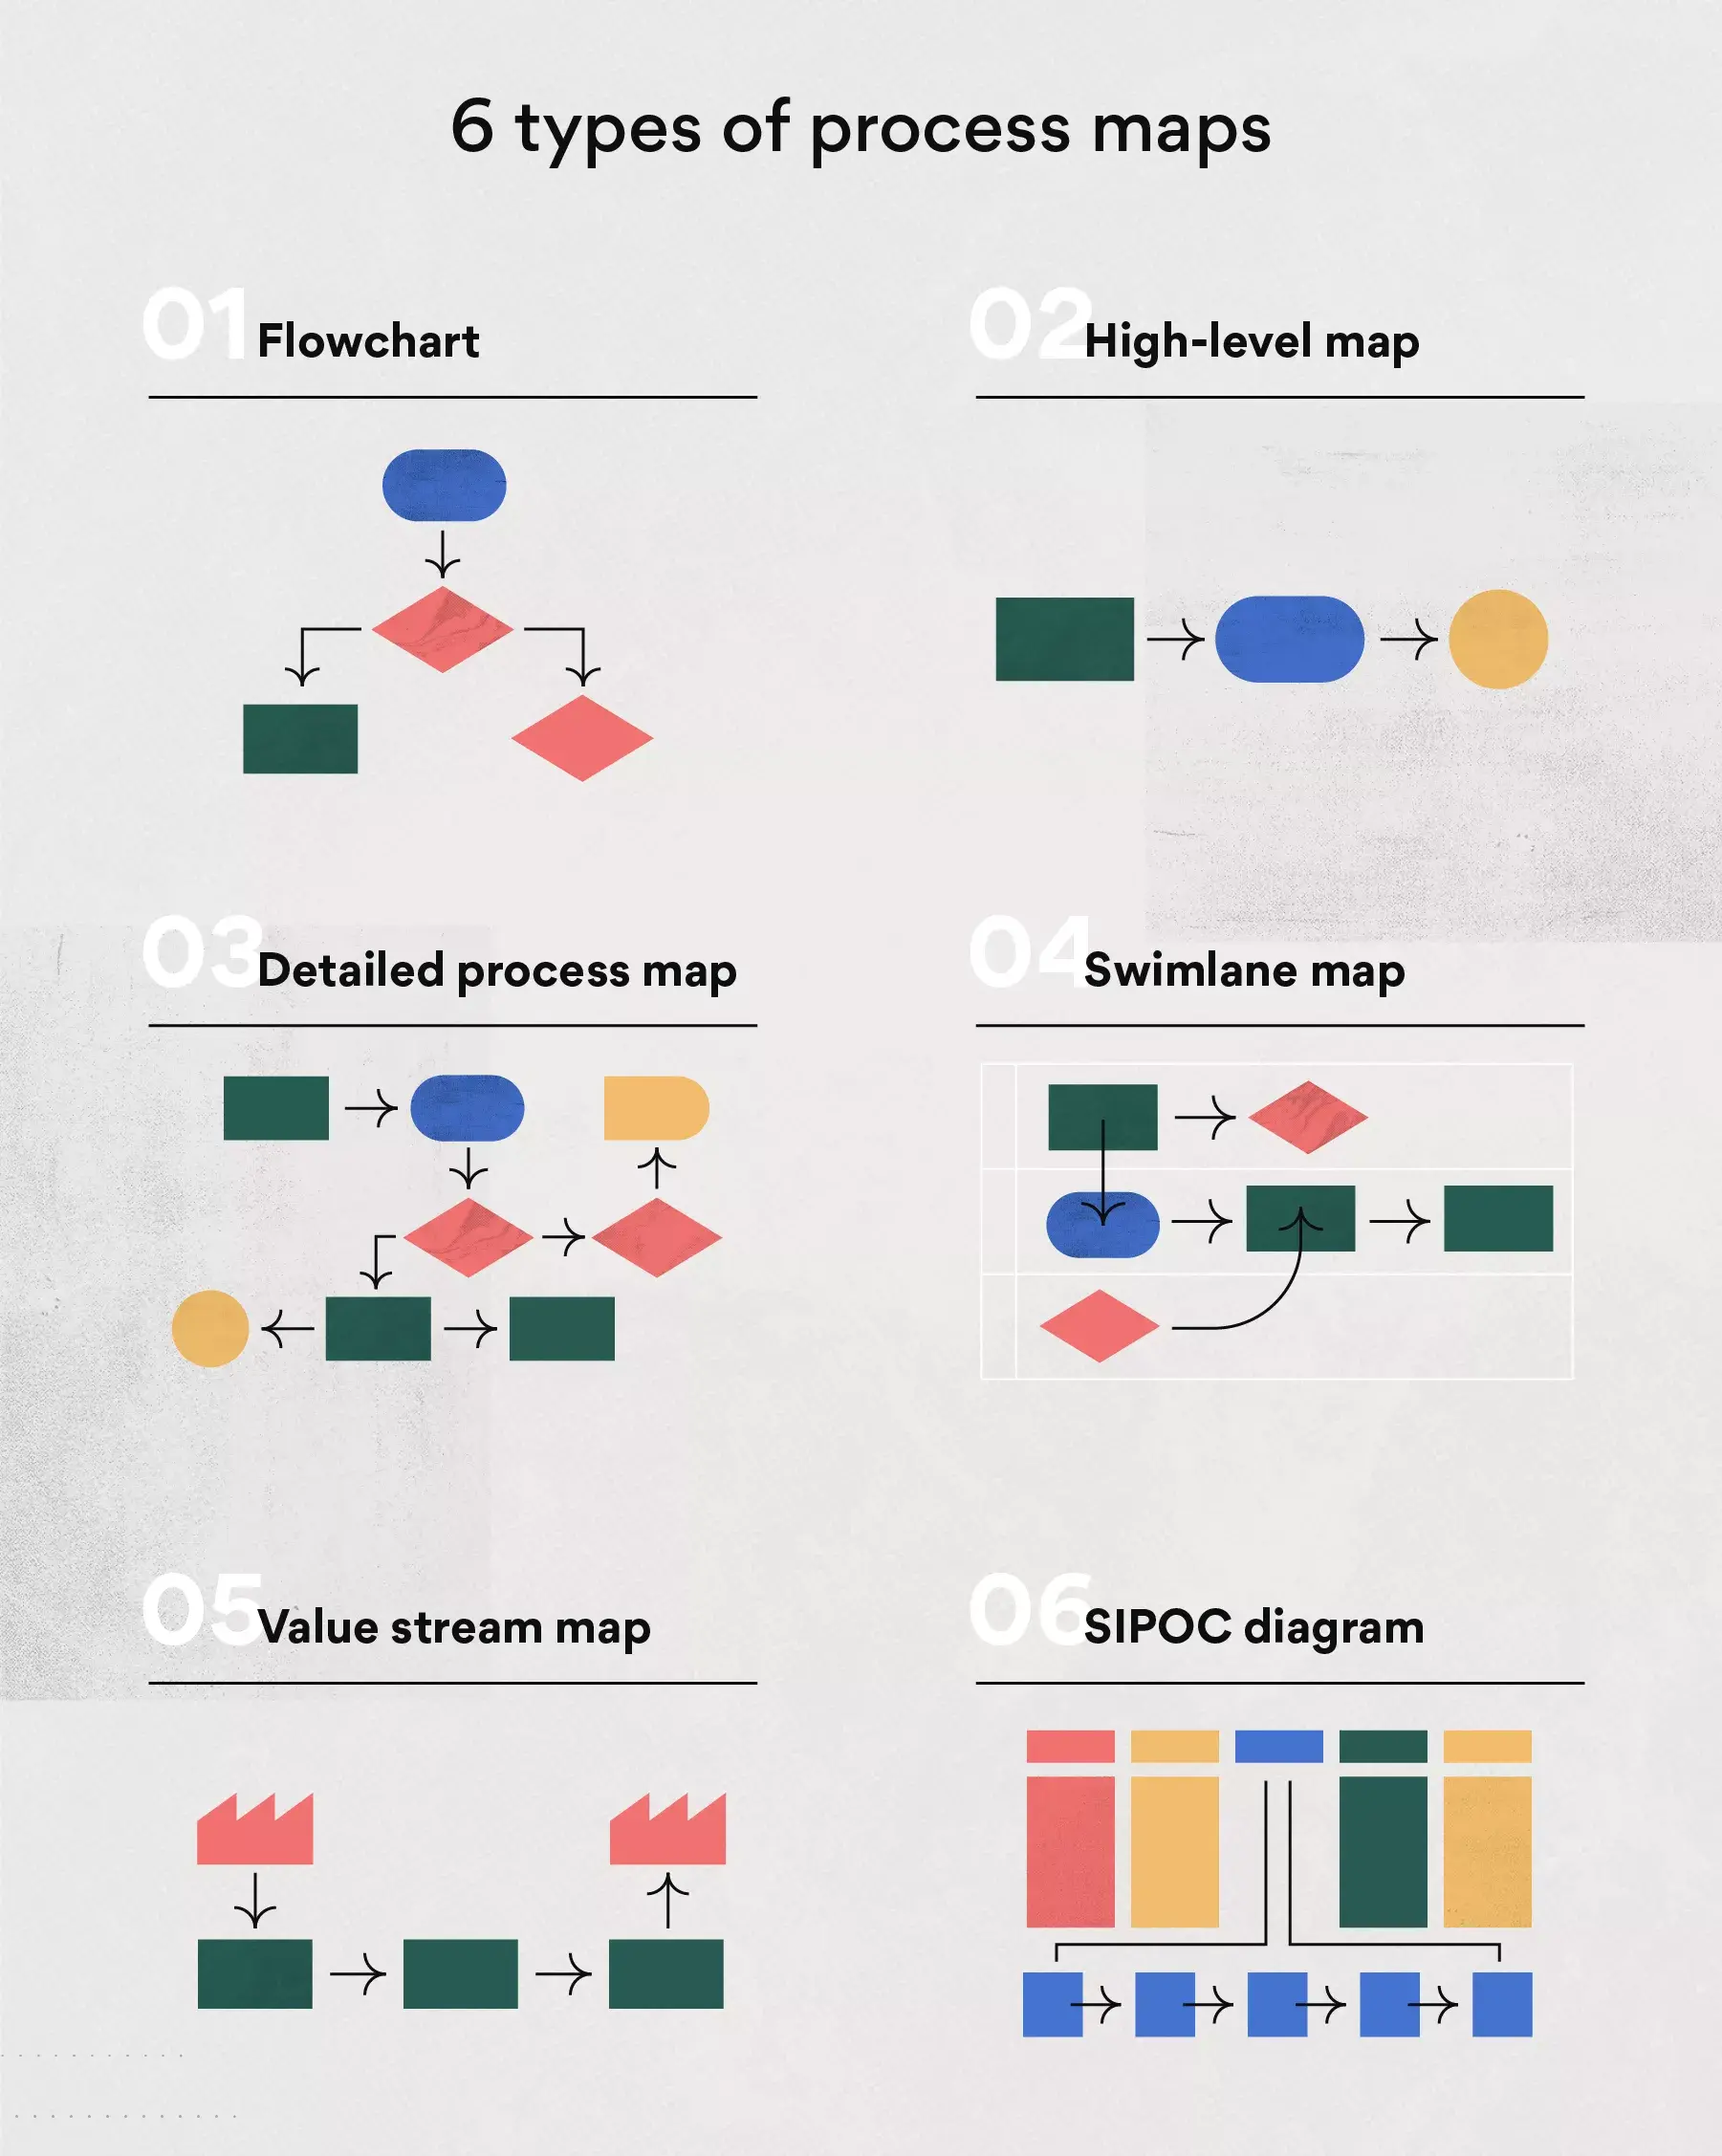
基本流程圖
基本流程圖是最簡單、使用最廣泛的流程圖類型。它使用標準的流程繪製符號,從頭到尾呈現輸入項、輸出項和流程步驟。
適用場景:
規劃新的工作流程
解決流程中的問題
改善團隊溝通
這也是在到職培訓或腦力激盪會議期間記錄流程的絕佳起點。
高階流程圖
高階流程圖 (又稱為由上而下圖或價值鏈圖) 能讓人對流程有鳥瞰式的概觀,省略了詳細資料,專注於關鍵階段。
在以下情況下,高階流程圖非常實用:
定義新的流程結構
與主管級專案關係人或外部合作夥伴分享概況
在建立詳細圖表之前先決定範疇
詳盡流程圖
此類型包含所有內容:行動、決策、子流程、輸入、輸出、指標和緊急應變項目。它通常會清楚標示決策點,並確切顯示誰負責什麼事項。
此圖最適合用於:
分析複雜的工作流程
尋找效率低下或延遲的情況
大規模標準化新專案
泳道圖
泳道圖又稱為跨職能流程圖,透過將職責分成橫向或垂直的「泳道」來組織流程。每個泳道代表一位人員、一個角色或一個團隊。
使用泳道圖可以:
標示當責
追蹤部門之間的交接事宜
改善跨職能工作流程中的協調
在流程變更期間明確角色
價值鏈圖
價值鏈圖是一種精實工具,用於追蹤產品或服務從開始到交付的整個歷程。它使用一組特殊的繪製符號來表示資訊和原物料在每個步驟中的流動情況。
它能擷取以下資料和指標:
週期時間
參與人數
發生浪費或延誤的地方
SIPOC 圖
SIPOC 圖的名稱源自五個英文單字的首字母:供應商 (Supplier)、輸入 (Input)、流程 (Process)、輸出 (Output)、客戶 (Customers)。這是一張結構化圖表,能在繪製更詳細的流程圖之前,提供工作流程的高階概觀。
將此流程繪製工具與六個標準差品管法或任何結構化的流程繪製練習搭配使用。SIPOC 的五個欄位中,每一個欄位都有助於闡明流程以及參與其中的專案關係人。
使用此工具可以:
定義複雜流程的範圍
確定所有要素和團隊成員
為流程改善專案設定清楚的界線
BPMN (業務流程模型與標記法)
BPMN 是一種用於繪製業務流程的標準化方法。它使用獨特的符號來顯示任務、事件和決策的流程,使技術和非技術團隊更容易保持一致。
當有以下需求時,BPMN 是不錯的選擇:
記錄跨工具或跨系統的邏輯
建立日後將自動化的工作流程
支援軟體整合或流程開發
流程圖繪製符號
流程圖使用通用的視覺語言來呈現工作如何從一個步驟推進到另一個步驟。這些符號改編自統一塑模語言 (UML),可協助呈現任務、決策和延遲等關鍵元素。
以下是最常見的流程繪製符號及其含義:
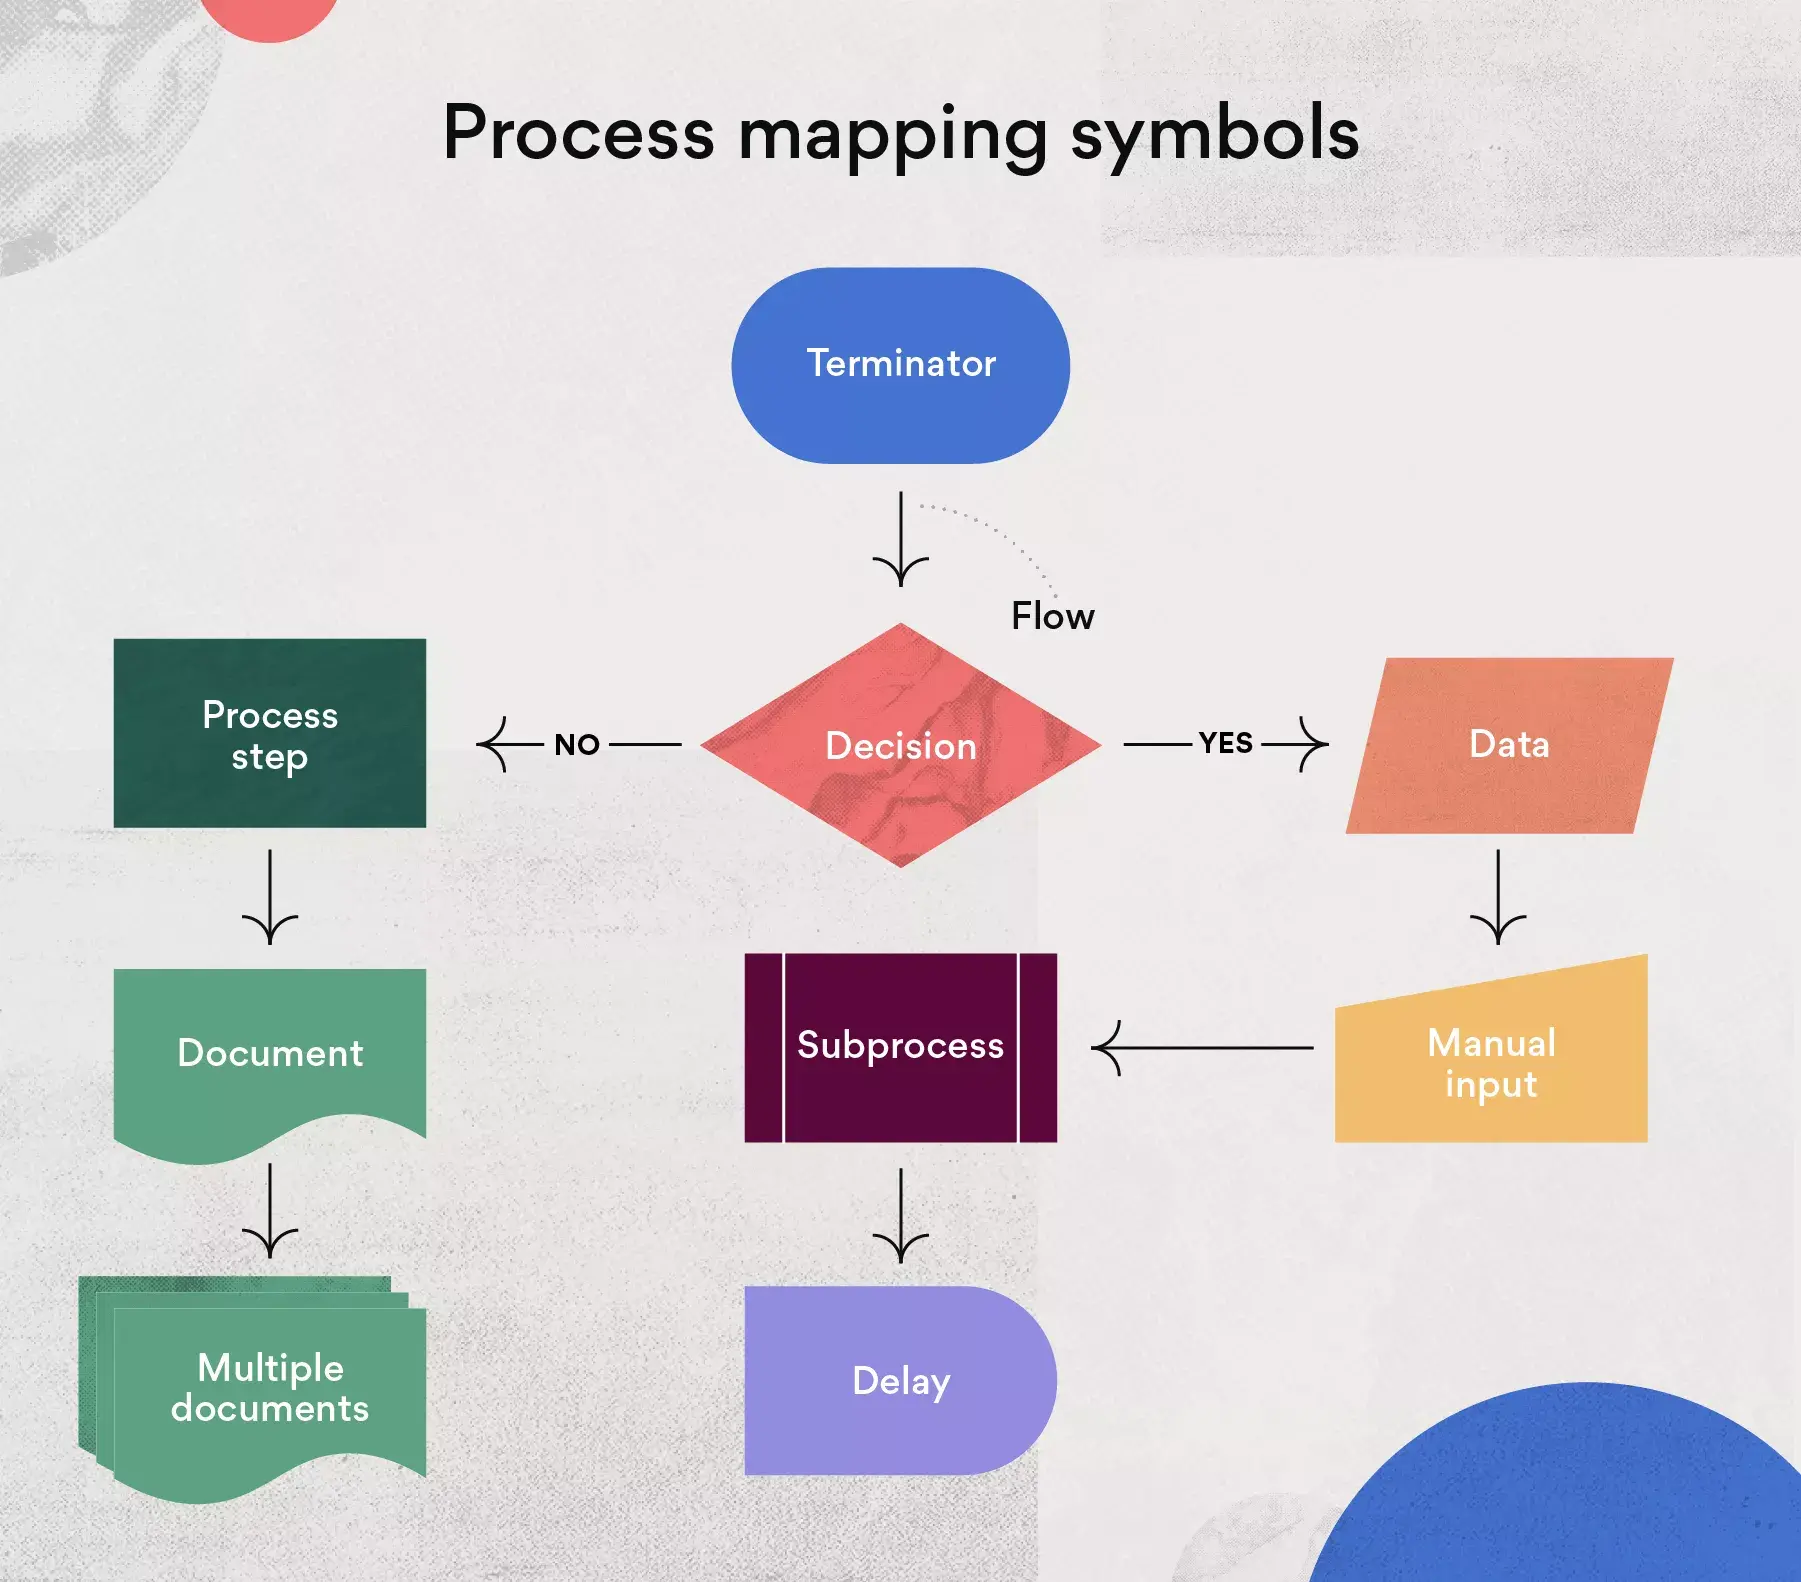
符號名稱 | 形狀 | 使用時機 |
終結符號 | 橢圓形 | 標記流程的起始點或結束點 |
流程步驟 | 矩形 | 顯示工作流程中的特定任務或行動 |
流程 | 箭頭 | 連結各個步驟,並顯示工作的方向 |
決策 | 菱形 | 表示具有多個結果的決策點 |
延期 | D 形 | 顯示暫停或延遲發生的位置 |
文件 | 底部呈波浪形的矩形 | 表示可供閱讀的文件或檔案 |
資料 | 平行四邊形 | 表示流入或流出某個步驟的資料 |
手動輸入 | 頂部傾斜的矩形 | 顯示必須手動輸入資料的位置 |
子流程 | 帶有兩條垂直線的矩形 | 表示在其他地方進行的預定義流程 |
這些是最常用的核心符號。隨著流程圖變得更加複雜,可以新增其他符號,但這一組符號是穩固的起點。
建立流程圖範本如何建立流程圖
可以使用紙筆、白板或流程圖繪製軟體來建立流程圖。雖然有現成的範本可用,但學習如何從零開始繪製流程圖,能讓人掌控每一個步驟。
步驟 1:選擇需要規劃的流程
選擇要繪製的具體流程。這可能是一個混亂、效率低下或對團隊成員來說不夠清楚的流程;也可能是需要說明的新流程,或是讓人感到困惑的複雜流程。請選擇一個流程,並為其取一個簡單的名稱。
步驟 2:列舉流程所涉及的每項活動和每個人員
首先,寫下流程中的每項任務,暫時不必擔心順序問題。列出所有輸入內容、行動,以及各任務由誰負責。
與團隊和其他專案關係人合作,以便:
發現重要的子流程
決定要納入多少詳細資料
清楚標記起始點和結束點
步驟 3:按順序排列步驟
拿著清單,按照正確的順序排列任務。從頭到尾逐步瀏覽目前的流程,並補上之前漏掉的任何步驟。這樣就能全面掌握工作流程。
步驟 4:繪製流程圖
選擇最合適的格式。依據詳細資料的不同等級和流程類型,選項包括:
基本流程圖
泳道圖
價值鏈圖
BPMN 圖表
使用標準的流程繪製符號來標記決策點、行動和連結。
閱讀:4 種類型的概念圖 (附免費範本)步驟 5:與團隊一起審查
與每一位參與其中的人一起檢查流程圖。確保整個流程準確無誤。詢問是否有任何步驟遺漏、任何任務重複,或任何地方不清楚。修正錯誤後,與團隊成員以及其他需要此資訊的人分享最終版本。
步驟 6:尋找問題並改善流程
流程圖反映了目前的狀態後,就可以將其作為流程改善的工具。尋找瓶頸、效率不彰之處和非必要的步驟。詢問團隊成員在哪些地方遇到瓶頸或感到困惑。
接著,透過刪減步驟、重新指派任務或新增自動化,對流程進行最佳化。更新流程圖以反映變更。持續改進就是這樣進行的:繪製流程圖、進行修正、重複這個過程。
流程圖繪製範例
儘管可以為任何種類的流程建立流程圖,但如何將此工具應用於團隊的實際工作中呢?以下提供幾個範例,幫助建立更具體的概念。
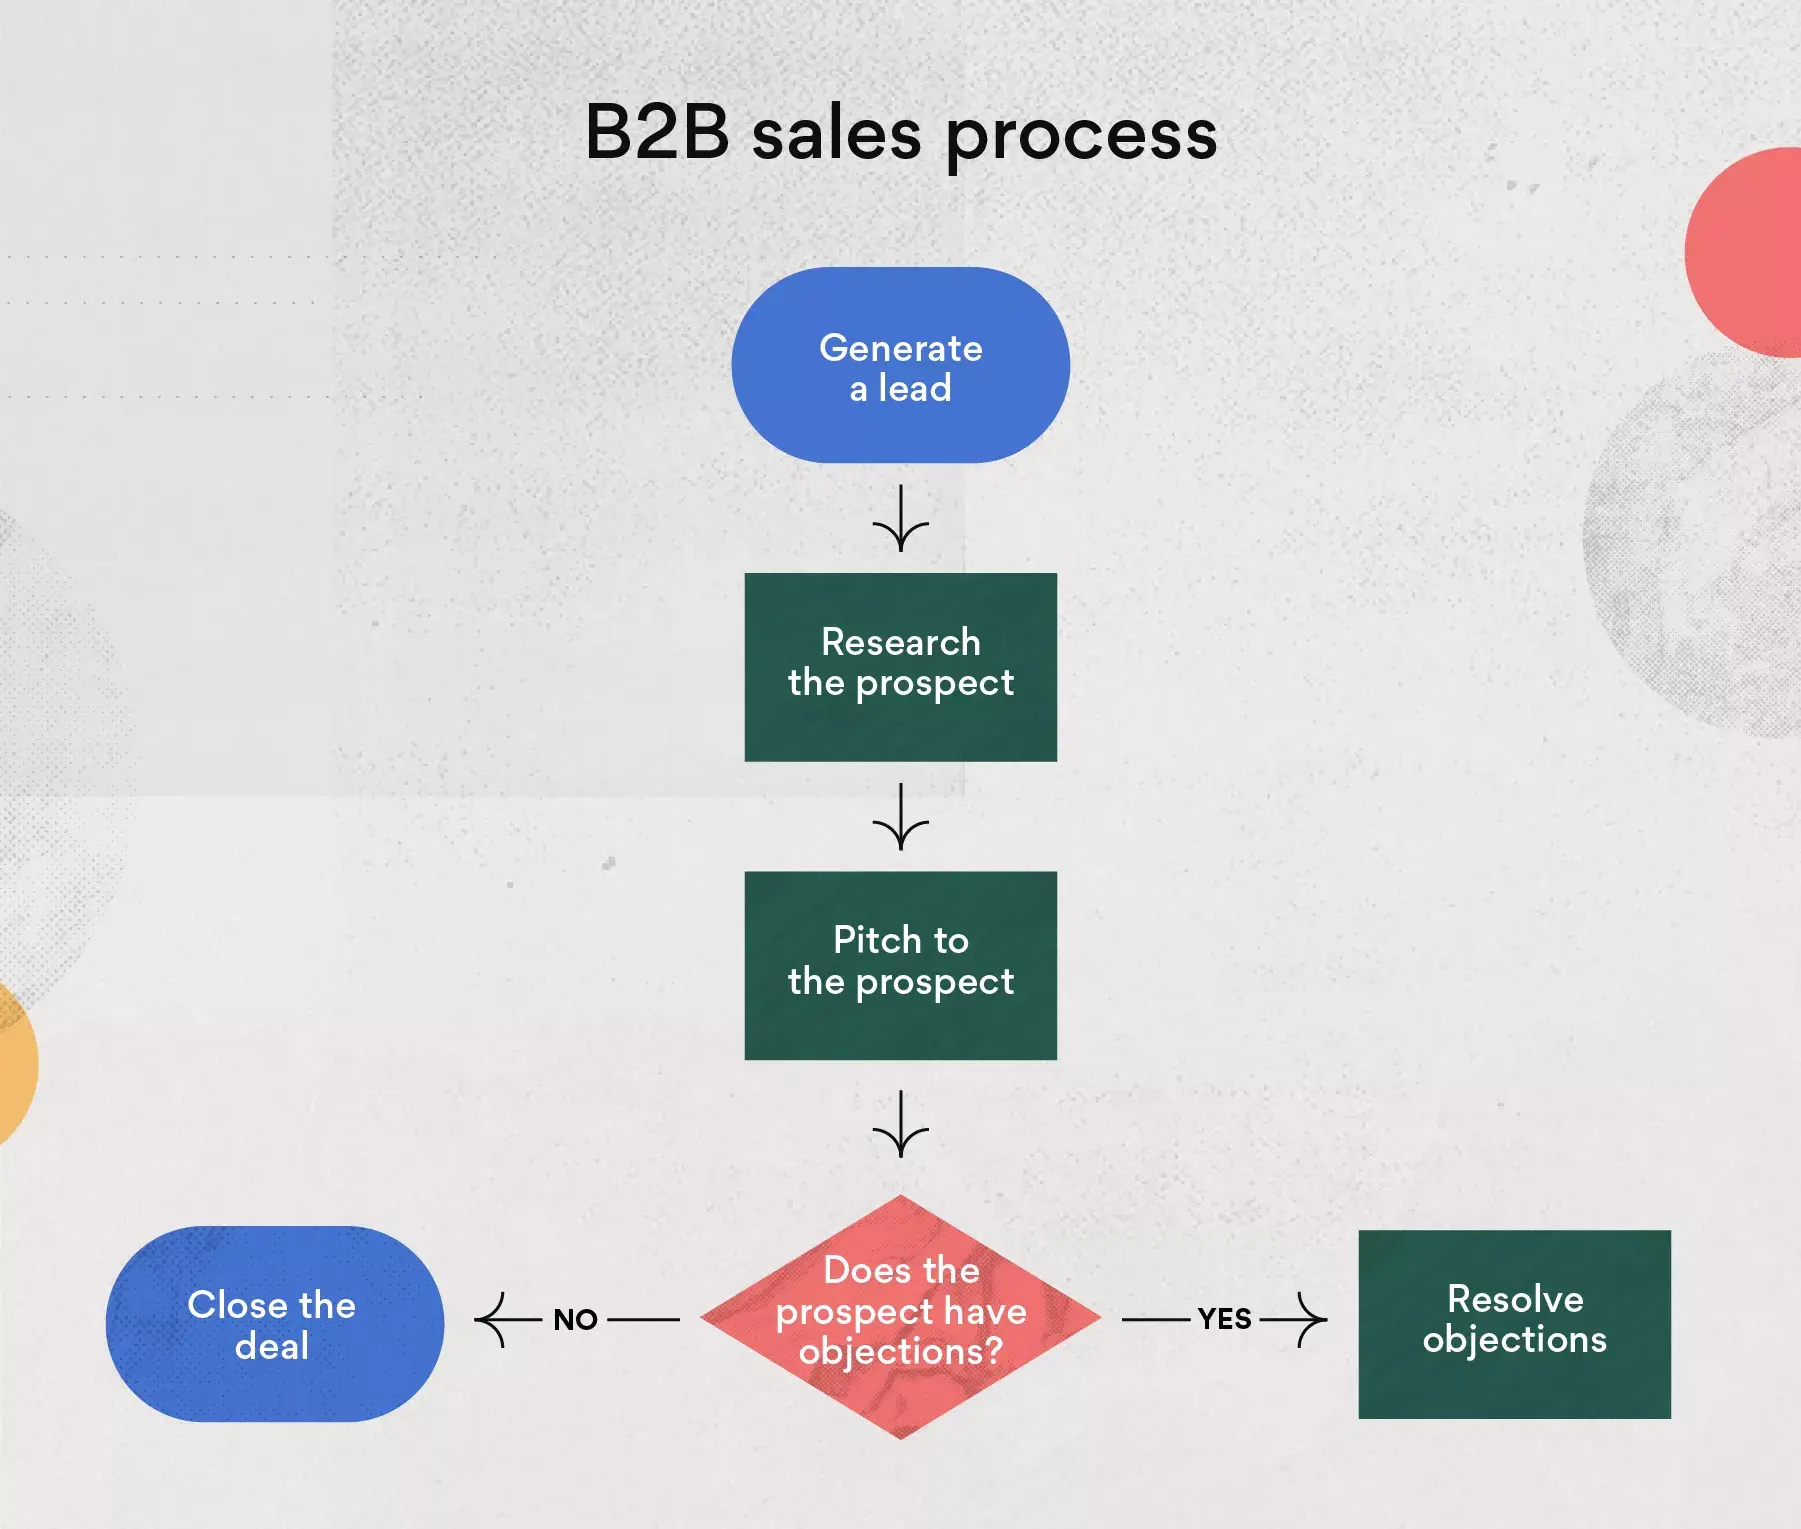
B2B 銷售流程
上圖呈現了一個典型的 B2B 銷售流程。從潛在客戶接觸開始,經過需求評估、報價、議價,最終到簽約和後續追蹤。每個決策點 (例如客戶是否符合資格) 都用菱形標示,讓銷售團隊清楚瞭解接下來該採取什麼行動。
員工到職流程
員工到職流程是另一個常見的流程映射範例。這類流程圖通常涵蓋以下步驟:HR 發出錄取通知、準備設備和帳號、安排第一天報到流程、進行部門培訓,以及完成試用期評估。使用泳道圖格式,可以清楚區分 HR、IT 部門和直屬主管各自負責的任務,避免交接時出現遺漏。
行銷活動審批流程
行銷團隊可以使用流程圖繪製來規劃活動審批流程。從活動企劃提案開始,經過創意團隊製作素材、主管審閱、法務合規檢查,到最終發佈。在每個審閱階段設定決策點 (核准或退回修改),確保每一步都有明確的負責人和時限,減少來回溝通的時間。
流程圖繪製技巧
可以根據團隊的需求量身打造流程圖,但一些最佳作法可以從一開始就幫助建立清晰、有效的流程圖。
以下是幾個流程圖繪製的最佳做法,可在每個階段充分運用。
在繪製流程圖之前進行規劃
設定範疇。確定起始點和結束點,讓圖表只包含必要的內容。
釐清目標。瞭解希望透過該流程實現哪些成果。
專注於結果。僅繪製具有清晰、可衡量結果的流程。
有目的地建立流程圖
逆向工作。從預期成果開始,然後按照相反的順序規劃步驟。
盡可能簡化。維持子流程易於遵循。
納入適當程度的詳細資料。不要過度複雜化,但也不要留下漏洞。
使用標準符號。僅使用常見的流程繪製符號,確保大家都能理解。
審閱並調整
取得回饋。讓流程中發揮作用的所有人員都參與進來。
考慮替代路徑。如果有多種方式可以實現目標,請將這些選項都納入其中。
繪製真實情況,而不是理想情況。展示流程目前的實際運作方式,然後再從這裡開始改善。
從規劃到審查,隨進度運用這些提示,以便繪製出清晰、實用且能真正推動改進的流程圖。
開始繪製流程圖,開始改進
流程繪製只是第一步。藉助免費的 Asana 流程圖範本,可以將工作流程視覺化,找出拖慢進度的因素,並使每個步驟都變得明晰。
繪製流程圖後,使用 Asana 讓工作持續推進,指派任務、追蹤進度,並從頭到尾保持資訊同步。準備好將流程圖付諸行動了嗎?立刻開始使用 Asana。
建立流程圖範本有關流程圖繪製的常見問題
流程圖繪製的基本步驟是什麼?
流程圖繪製通常包含六個步驟:選擇要繪製的流程、列出所有相關活動和人員、按順序排列步驟、使用標準符號繪製流程圖、與團隊一起審查準確性,最後找出問題並持續改善。
流程圖和流程映射有什麼區別?
流程圖 (flowchart) 是以符號和箭頭呈現步驟的圖表,是流程映射中最常用的視覺化格式。流程映射 (process mapping) 涵蓋更廣,除了流程圖之外,還包括泳道圖、價值鏈圖、SIPOC 圖和 BPMN 等多種格式。
流程映射有哪些常見類型?
常見的流程映射類型包括:基本流程圖 (適合簡單流程)、高階流程圖 (適合高層概覽)、詳盡流程圖 (適合複雜工作流程)、泳道圖 (適合跨職能流程)、價值鏈圖 (適合 Lean 改善)、SIPOC 圖 (適合範疇定義) 和 BPMN (適合自動化與系統整合)。
流程映射對團隊有什麼好處?
流程映射能幫助團隊找出工作流程中的瓶頸和效率低下之處、明確每個步驟的負責人、改善跨部門溝通、加快決策速度,並建立可重複使用的流程文件。這些好處有助於減少錯誤、縮短交付時間,並提升整體工作品質。
如何在工作中開始使用流程映射?
建議從一個經常出現問題或延遲的流程開始。召集相關人員,共同記錄目前的工作方式,然後使用流程圖繪製工具將其視覺化。找出需要改善的部分,制定改善計劃,並定期更新流程圖以反映變更。像 Asana 這樣的工作管理平台可以幫助將流程圖中的步驟轉化為可追蹤的任務。