Wykres PERT: co to jest, jak go utworzyć i przykłady


Podsumowanie
Mamy doskonałe rozwiązanie dla osób, które kiedykolwiek napotkały problemy z mapowaniem zadań lub śledzeniem zależności w projekcie. Wykres PERT, zwany również diagramem PERT lub diagramem sieciowym, to narzędzie używane do planowania, organizowania i mapowania zadań w projekcie. Sprawdza się nie tylko w zarządzaniu projektami IT, ale również w budownictwie, logistyce czy organizacji wydarzeń. Metoda ta jest szczególnie wartościowa przy tworzeniu harmonogramów projektów o wielu zmiennych.
Skrót PERT (ang. Program Evaluation and Review Technique) oznacza probabilistyczną metodę planowania i kontroli projektu. Oferuje reprezentację wizualną osi czasu projektu oraz tworzy zestawienie poszczególnych zadań. Wykresy te są podobne do wykresów Gantta, ale mają inną strukturę. Wykres ten przedstawia kroki, które należy wykonać, aby przejść od daty rozpoczęcia projektu do daty jego zakończenia. W tym artykule opiszemy pięć kroków tworzenia wykresu PERT, przedstawimy praktyczne przykłady i objaśnimy, jak wydajnie korzystać z tej metody w codziennej pracy.
Jak działa wykres PERT
Wykres PERT przedstawia zadania w projekcie jako węzły i łączy je strzałkami, aby pokazać zależności. To wizualne podejście pomaga kierownikom projektów tworzyć realistyczne harmonogramy, szacować osie czasu i przekazywać plany interesariuszom przed rozpoczęciem pracy.
Każdy węzeł wykresu PERT może zawierać kluczowe informacje o zadaniu: najwcześniejszy czas rozpoczęcia (ES), najwcześniejszy czas zakończenia (EF), najpóźniejszy czas rozpoczęcia (LS) oraz najpóźniejszy czas zakończenia (LF). Te wartości pozwalają określić, ile zapasu czasowego ma dane zadanie i czy leży na ścieżce krytycznej projektu. W praktyce oznacza to, że na pierwszy rzut oka widać, które zadania nie mogą się opóźnić bez wpływu na termin końcowy.
Utworzenie harmonogramu projektu, takiego jak wykres PERT, umożliwia wykonanie kilku działań w ramach planowania projektu, w tym:
Uzyskanie od kierownictwa zatwierdzenia harmonogramu i osi czasu.
Zakomunikowanie interesariuszom celów projektu.
Stworzenie wizualnej mapy złożonego projektu i jego współzależności.
Oszacowanie czasu potrzebnego na wykonanie poszczególnych zadań.
Aby w pełni skorzystać z potencjału wykresu PERT, należy najpierw zrozumieć kroki wymagane do jego utworzenia oraz sposób wizualnego mapowania wykresu.
Historia i pochodzenie wykresów PERT
Metoda PERT (ang. Program Evaluation and Review Technique, probabilistyczna metoda planowania i kontroli projektu) została opracowana pod koniec lat 50. przez Marynarkę Wojenną Stanów Zjednoczonych do zarządzania złożonym projektem pocisków Polaris. Jej celem było uproszczenie planowania i ustalania harmonogramu dla przedsięwzięć na dużą skalę z wieloma zmiennymi.
PERT została stworzona równolegle z metodą ścieżki krytycznej i podobnie jak ona koncentruje się na mapowaniu zależności między zadaniami. Chociaż pierwotnie wykresy PERT były rysowane ręcznie, obecnie tworzy się je za pomocą oprogramowania, co czyni je cennym narzędziem dla nowoczesnych zespołów zarządzających złożoną pracą o niepewnych ramach czasowych.
Wypróbuj integrację Lucidchart + AsanaJak utworzyć wykres PERT
Jeśli chcesz wyprzedzać terminy, utworzenie wykresu PERT jest właściwym rozwiązaniem. Ten przewodnik przeprowadzi Cię krok po kroku przez proces tworzenia wykresu PERT, dzięki czemu z łatwością zwizualizujesz każde zadanie, zależność i termin.
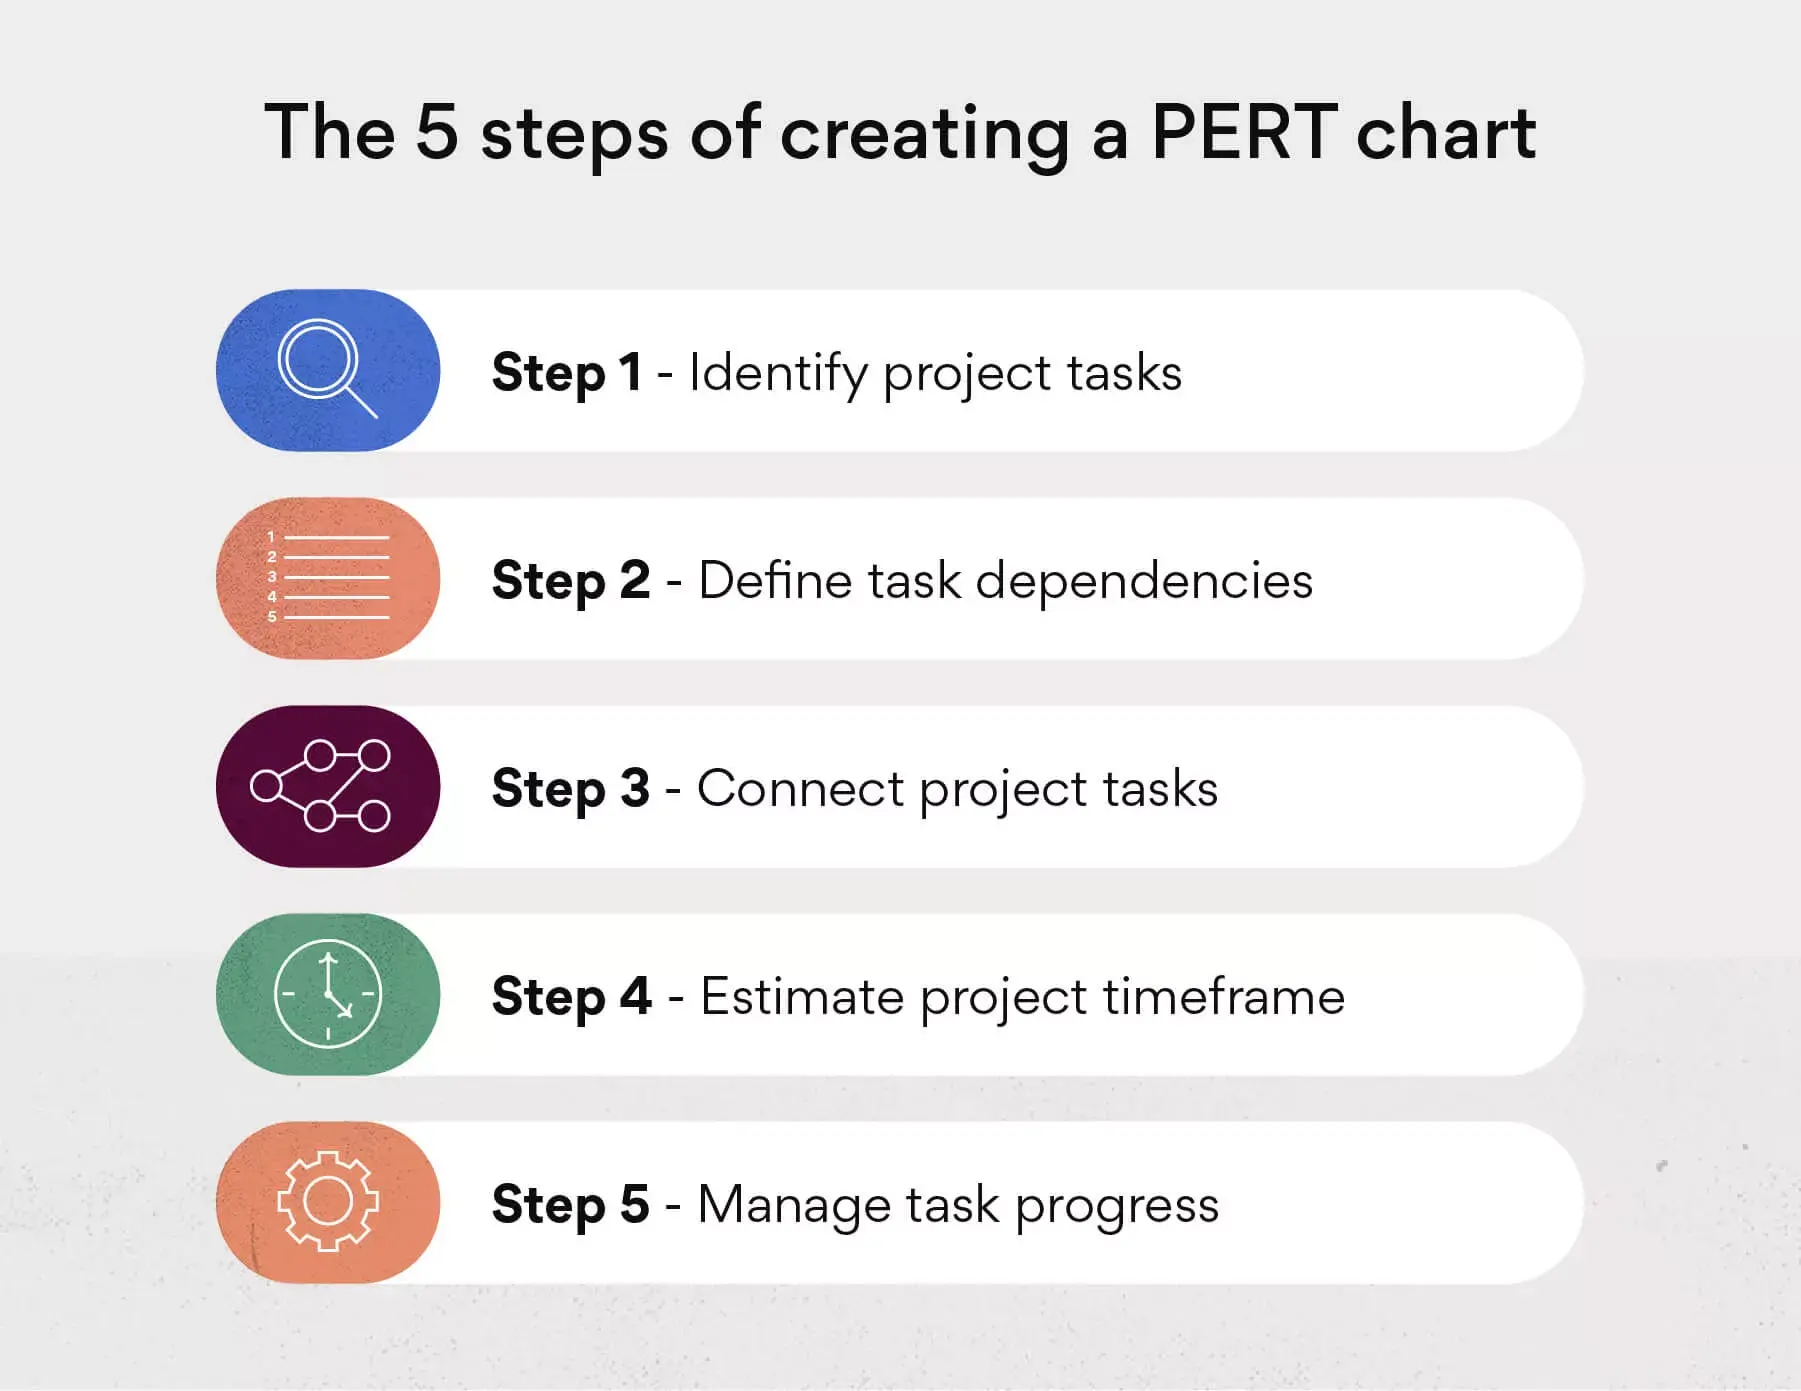
1. Określ zadania projektu
Pierwszym krokiem tworzenia wykresu PERT jest etap planowania projektu, na którym określasz kluczowe zadania, które będą kształtować Twój harmonogram. Zanim zdefiniujesz zależności między zadaniami, poświęć czas na zebranie niezbędnych szczegółów i ustalenie zakresu prac. Przydatne będą między innymi:
Wczesne wykonanie tych podstawowych czynności zapewni Ci gotowość do połączenia zależnych zadań i ustalenia jasnego zakresu projektu przed przejściem do kolejnych etapów.
2. Określ zależności zadań
Zależność zadania to zadanie lub kamień milowy, które muszą zostać ukończone, zanim będzie można rozpocząć dane zadanie. Zadania zależne są podstawowym elementem metody PERT, często określanym mianem relacji logicznej, i są powszechnie stosowane w strukturze podziału pracy.
Utworzenie zależności może ułatwić poprawne śledzenie pracy, zapewnienie realizacji zadań oraz nawiązanie czytelnej komunikacji, zwłaszcza w przypadku złożonych projektów. Bez dobrze zdefiniowanych zależności trudno jest zaplanować osie czasu i oszacować łączny czas trwania projektu.
Wykres PERT przedstawia zależności za pomocą łączenia i numerowania zadań. Mimo tego że nie jest on tak szczegółowy, jak struktura podziału pracy, zapewnia jasny przegląd relacji między zadaniami i wymaganej pracy.
[Przeczytaj] 12 wskazówek, jak efektywnie komunikować się w środowisku pracy3. Połącz zadania projektu
Po ustaleniu zależności zadań rozpocznij tworzenie wykresu PERT, łącząc zadania projektu. Połączenia te zawierają strzałki reprezentujące zadania oraz węzły, które są odzwierciedleniem wydarzeń lub kamieni milowych.
Umieść na przykład wydarzenia nadrzędne w węzłach (przedstawione jako numerowane okręgi lub kwadraty) i narysuj strzałki zadań, aby wyznaczyć zależności wymagane do ukończenia wydarzeń. Ten układ diagramu sieciowego zapewnia prostą strukturę, która jest łatwa do zrozumienia dla interesariuszy projektu.
4. Oszacuj ramy czasowe projektu
Teraz nadeszła pora na oszacowanie ogólnych ram czasowych projektu za pomocą metody ścieżki krytycznej (ang. Critical Path Method - CPM) i równania PERT. Ścieżka krytyczna to najdłuższa sekwencja zadań, które muszą zostać ukończone do pomyślnego zrealizowania całego projektu.
Celem jest określenie najdłuższej sekwencji zadań, aby oszacować najkrótszy możliwy czas trwania projektu. Szacowany czas w analizie PERT opiera się na trzech wartościach:
Optymistyczny termin (O): minimalny czas potrzebny na wykonanie zadania, zakładając najlepszy możliwy scenariusz.
Pesymistyczny termin (P): maksymalny czas potrzebny na wykonanie zadania, uwzględniający najbardziej niekorzystne okoliczności.
Najbardziej prawdopodobny termin (N): realistyczna ocena czasu potrzebnego na wykonanie zadania w typowych warunkach.
Korzystając z obliczeń PERT, możesz oszacować oczekiwany czas trwania zadania za pomocą formuły PERT:
Oczekiwany czas (TE) = (O + (4 x N) + P) / 6
Wartość tę można mierzyć w minutach, godzinach, dniach, a nawet tygodniach. Formuła nadaje największą wagę najbardziej prawdopodobnemu terminowi (N), co zapewnia wyważone oszacowanie uwzględniające zarówno optymistyczne, jak i pesymistyczne scenariusze.
Oprócz oczekiwanego czasu metoda PERT pozwala obliczyć wariancję, miarę niepewności oszacowania. Wzór na wariancję to:
Wariancja = ((P - O) / 6)^2
Im wyższa wariancja, tym większa niepewność co do faktycznego czasu realizacji zadania. Analiza wariancji pomaga zidentyfikować zadania o największym ryzyku opóźnień.
Jeśli na przykład optymistyczny termin zadania to 30 minut, pesymistyczny termin wynosi 60 minut, a najbardziej prawdopodobny termin ma wartość 45 minut, obliczenia przybiorą postać:
(30 min + (4 x 45 min) + 60 min) / 6 = 45 minut.
Po wykonaniu szacunków PERT dla każdego zadania zsumuj je wzdłuż ścieżki krytycznej, aby określić ogólny harmonogram projektu.
5. Zarządzaj postępem zadań
Ostatnim krokiem tworzenia wykresu PERT jest zarządzanie postępem do momentu ukończenia projektu. Obejmuje to monitorowanie zależności zadań, usuwanie wąskich gardeł i zapewnienie osiągnięcia wszystkich kamieni milowych projektu.
Wykres PERT w zarządzaniu projektami należy aktualizować w czasie rzeczywistym w miarę pojawiania się zmian. Połączenie go z procesem kontroli zmian może ułatwić śledzenie modyfikacji i utrzymanie przejrzystej komunikacji.
Po ukończeniu wszystkich zadań zarchiwizuj materiały projektowe we współdzielonej przestrzeni, aby mieć łatwy dostęp do wcześniejszych przykładów analizy PERT.
Przeczytaj: Dlaczego jasny plan komunikacji jest ważniejszy, niż myśliszPrzykładowy wykres PERT
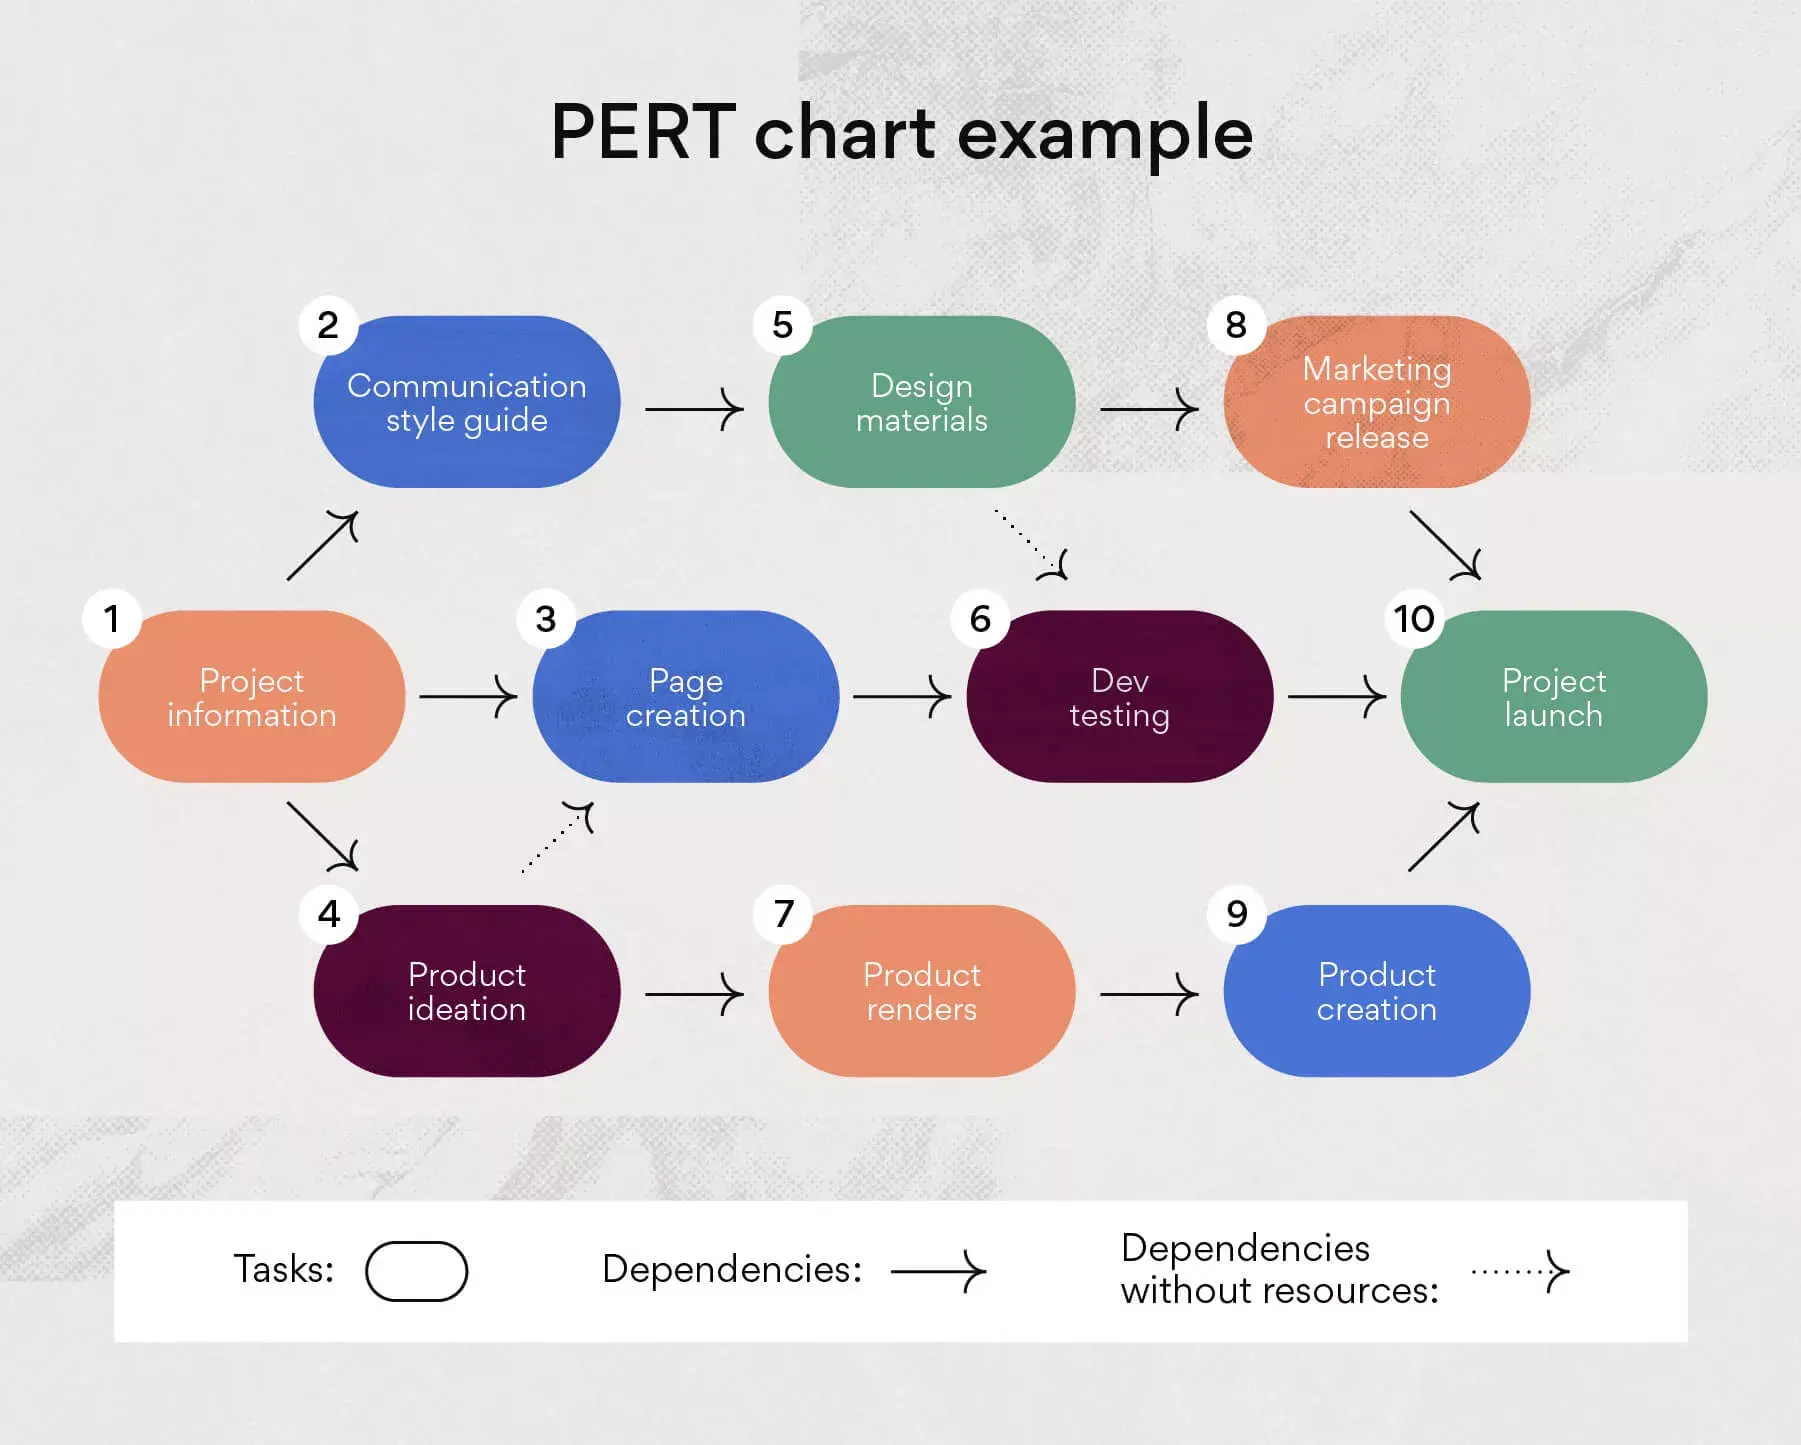
Teraz, kiedy wiesz już, jak utworzyć wykres PERT, możesz utworzyć swój własny wykres. Ponieważ każdy projekt różni się złożonością i ramami czasowymi, Twój wykres PERT może wyglądać inaczej. Jednak podstawowa struktura - węzły połączone strzałkami z wartościami czasowymi - pozostaje taka sama niezależnie od branży.
Aby rozpocząć, wykonaj następujące kroki:
Narysuj ponumerowane węzły: przedstawiają one główne wydarzenia w projekcie, zwane również zadaniami nadrzędnymi. Po ukończeniu te węzły razem utworzą pełny projekt. Twój przykładowy wykres PERT może zawierać dowolną liczbę zadań, ale na początek warto zacząć od 10 zadań.
Połącz węzły z zadaniami: użyj strzałek, aby zilustrować zależności między zadaniami. Te zadania muszą zostać ukończone, aby można było przejść do kolejnego kamienia milowego. Chociaż przykładowy wykres PERT powinien mieć określony początek i koniec, jego środkowa część może być bardziej złożona, ponieważ zależności rozgałęziają się.
Przykładowy wykres PERT z rozwiązaniem
Oto przykład PERT z rozwiązaniem, który pozwoli Ci uzyskać jaśniejszy obraz tego, jak te elementy łączą się ze sobą. Załóżmy, że zarządzasz uruchomieniem strony internetowej z trzema głównymi ścieżkami zadań:
Ścieżka A: projektowanie interfejsu (O = dwa dni, N = cztery dni, P = osiem dni). TE = (2 + 16 + 8) / 6 = 4,33 dnia.
Ścieżka B: tworzenie treści (O = trzy dni, N = pięć dni, P = dziewięć dni). TE = (3 + 20 + 9) / 6 = 5,33 dnia.
Ścieżka C: konfiguracja serwera (O = jeden dzień, N = dwa dni, P = pięć dni). TE = (1 + 8 + 5) / 6 = 2,33 dnia.
Ścieżka krytyczna to ścieżka B, ponieważ ma najdłuższy oczekiwany czas - 5,33 dnia. To oznacza, że opóźnienie w tworzeniu treści bezpośrednio wydłuży cały projekt. Ścieżki A i C mają zapas czasowy i mogą się nieznacznie opóźnić bez wpływu na termin końcowy. Dzięki tej analizie wiesz, na które zadania skierować największą uwagę.
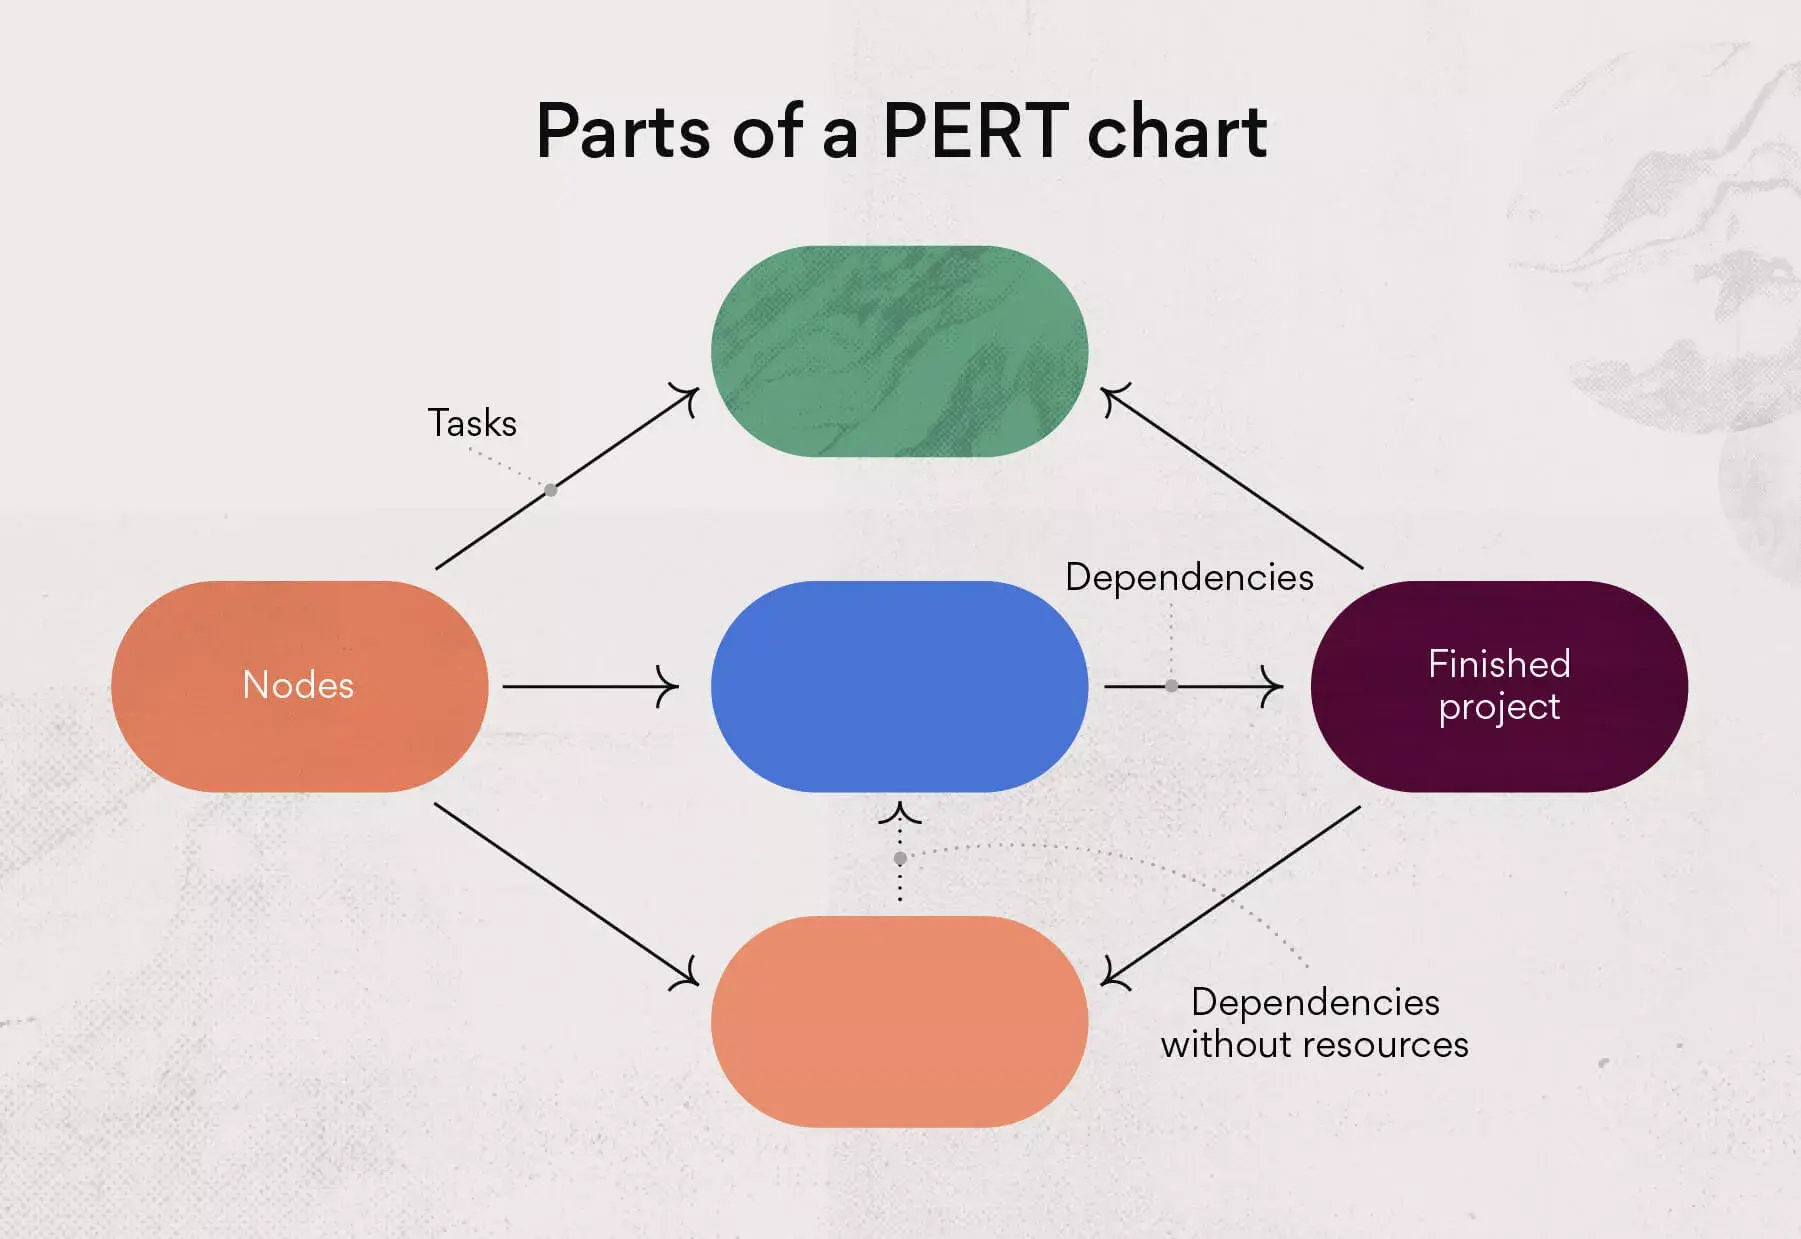
Co powinien zawierać szablon wykresu PERT?
Szablon wykresu PERT zazwyczaj zawiera kilka kluczowych elementów, które pomagają uporządkować i zwizualizować działania w projekcie. Poniżej znajdziesz listę typowych terminów wraz z ich definicjami:
Węzły: węzły przedstawiają wydarzenia w projekcie, główne składniki tworzących cały projekt. Na przykład w projekcie witryny internetowej węzłem może być design nowego logo.
Zadania: zadania to konkretne działania wymagane do ukończenia węzła. Na przykład, jeśli węzłem jest design nowego logo, zadaniem może być stworzenie trzech szkiców logo.
Zależności: zależności zadań określają relacje między zadaniami, co oznacza, że jedno zadanie musi zostać ukończone, zanim będzie można rozpocząć inne. Na przykład strona docelowa nie może zostać opublikowana, dopóki tekst nie zostanie napisany i zatwierdzony.
Zależności bez zasobów: niektóre zależności istnieją bez bezpośredniego powiązania z zadaniami. Na przykład wprowadzenie produktu i jego witryny internetowej są powiązane ze sobą, ale niekoniecznie mają wspólne zależne zadanie.
Jaki jest najprostszy sposób na stworzenie szablonu wykresu PERT? Użyj narzędzia do zarządzania projektami. Pomaga ono określić zależności zadań, monitorować oś czasu projektu i wykrywać wąskie gardła, zanim Cię spowolnią.
Możesz również połączyć szablon wykresu PERT z narzędziami wizualnymi, takimi jak Lucidchart. Te aplikacje umożliwiają członkom zespołu współpracę w czasie rzeczywistym, bieżące dostosowywanie harmonogramu projektu i utrzymywanie wszystkiego na dobrej drodze do ukończenia projektu - a wszystko to w jednym miejscu.
Wypróbuj integrację Lucidchart + AsanaWykres PERT a wykres Gantta
Mimo kilku kluczowych różnic, wykresy PERT i wykresy Gantta są często mylone. Oto krótkie porównanie:
Funkcja | Wykres PERT | Wykres Gantta |
Format wizualny | Schemat blokowy (diagram sieciowy) | Wykres słupkowy (pozioma oś czasu) |
Najlepszy do | Planowanie i szacowanie czasu | Śledzenie zadań podczas wykonywania |
Pokazuje zależności | Tak, jako główny cel | Ograniczone |
Układ | Elastyczny, z możliwością dostosowywania | Ustrukturyzowany, zorganizowany |
Kiedy korzystać | Przed rozpoczęciem projektu | Przez cały cykl życia projektu |
Podczas wyboru wykresu odpowiedniego dla Twoich potrzeb warto jest wziąć pod uwagę kilka kluczowych cech:
Wykresy PERT są schematami blokowymi, a wykresy Gantta wykresami słupkowymi: wykresy Gantta to tradycyjne wykresy słupkowe. Wykresy PERT mają mniej ścisłą strukturę i ich układ różni się w zależności od projektu.
Wykresy Gantta oferują organizację, a wykresy PERT możliwość ich dostosowania: wykresy Gantta mają bardziej zorganizowaną strukturę. Wykresy PERT umożliwiają łatwe dostosowanie ich układu, co jest lepsze dla ogólnych wymagań projektu.
Wykresów PERT można używać przed rozpoczęciem projektu: często są używane jako pomoc wizualna na etapie rozpoczęcia projektu. Kierownicy projektu następnie korzystają z wykresu Gantta lub struktury podziału pracy, aby mapować zadania podczas realizacji.
Warto również wspomnieć o różnicy między PERT a metodą ścieżki krytycznej (CPM). Choć obie metody koncentrują się na zależnościach między zadaniami, PERT operuje na szacunkach probabilistycznych (trzy warianty czasu), podczas gdy CPM zakłada deterministyczne, stałe czasy trwania. W praktyce oznacza to, że PERT lepiej sprawdza się w projektach o dużej niepewności, natomiast CPM jest preferowany, gdy czasy zadań są dobrze znane z wcześniejszych doświadczeń. Aby zastosować CPM w praktyce, możesz skorzystać z szablonu metody ścieżki krytycznej.
Wykresy Gantta są bardziej popularne podczas śledzenia zadań w całym cyklu życia projektu, a wykresy PERT sprawdzają się podczas mapowania czasu na początkowych etapach planowania. Można ich używać osobno lub razem.
Kiedy skorzystać z wykresu PERT
Użyj wykresu PERT, gdy musisz ocenić osie czasu, określić wymagania dotyczące zasobów lub wyznaczyć ścieżkę krytyczną projektu. Metoda ta znajduje zastosowanie w wielu branżach - od projektów IT po budownictwo i organizację wydarzeń. Oto sytuacje, w których metoda PERT jest właściwym wyborem:
Określanie ścieżki krytycznej: jedną z kluczowych cech wykresu PERT odróżniającą go od innych metod jest możliwość określenia ścieżki krytycznej projektu. Jest to istotne podczas wizualizacji ogólnej osi czasu projektu.
Ocena zasobów: dzięki wyjątkowym cechom wykresu PERT możesz łatwo wyświetlić zadania wymagające i niewymagające zasobów. Połączenie wykresu PERT z technikami równoważenia zasobów pozwala jeszcze lepiej zarządzać dostępnością zespołu. Oszczędza to Tobie i interesariuszom projektu czas przez czytelne udostępnienie tych informacji.
Oszacowanie czasu: ponieważ wykres PERT uwzględnia zarówno czas trwania poszczególnych zadań, jak i całego projektu, jest idealnym narzędziem do poznania oczekiwanej osi czasu w początkowej fazie planowania projektu.
Projekty IT z wieloma zależnościami: na przykład wdrożenie nowego systemu ERP wymaga koordynacji migracji danych, konfiguracji modułów i szkoleń. Wykres PERT pomaga zwizualizować te równoległe ścieżki.
Projekty budowlane: budowa obiektu obejmuje wiele etapów - od fundamentów po wykończenie, gdzie kolejność prac jest ściśle określona, a opóźnienia jednego etapu wpływają na cały harmonogram.
Podsumowując, utworzenie wykresu PERT jest dobrym rozwiązaniem, gdy potrzebujesz przejrzystego planu projektu do udostępnienia członkom zespołu. Skorzystaj z tego wykresu, aby szybko udostępniać zasoby i osie czasu.
Zalety i wady wykresów PERT
Tak jak każde narzędzie do zarządzania projektami, wykresy PERT mają swoje mocne i słabe strony. Ich zrozumienie pomoże Ci zdecydować, czy są one odpowiednie dla Twojego projektu.
Zalety wykresów PERT
Przejrzysta wizualizacja: zapewniają przejrzystą wizualną mapę całego projektu, ułatwiając zrozumienie sekwencji zadań i zależności.
Lepsze prognozowanie: dzięki wykorzystaniu optymistycznych, pesymistycznych i najbardziej prawdopodobnych szacunków czasu, PERT pomaga tworzyć bardziej realistyczne osie czasu projektu.
Analiza zależności: wykres wyraźnie podkreśla zależności między zadaniami, pomagając zespołom zidentyfikować ścieżkę krytyczną i potencjalne wąskie gardła.
Lepsza komunikacja: wykres PERT to przydatne narzędzie do przekazywania interesariuszom planów projektów i osi czasu w prostym, wizualnym formacie.
Wady wykresów PERT
Mogą być subiektywne: szacunki czasu opierają się na prognozach zespołu, które mogą być subiektywne i, jeśli nie zostaną starannie przeanalizowane, mogą prowadzić do niedokładnych osi czasu.
Skomplikowane tworzenie: w przypadku dużych projektów z wieloma zadaniami tworzenie i utrzymywanie wykresu PERT może być czasochłonne.
Skup się na terminach, a nie na zasobach: wykresy PERT koncentrują się przede wszystkim na osi czasu projektu i z założenia nie uwzględniają zarządzania zasobami ani budżetu.
Planuj do przodu z wykresem PERT
Diagram PERT pomaga precyzyjnie zaplanować kolejny projekt. Dzięki czytelnemu układowi i wartościom szacunkowym osi czasu zespół zyska kierunek dla zadań i będzie przygotowany na przyszłe wyzwania. W połączeniu z funkcjami AI dostępnymi w Asanie możesz jeszcze szybciej identyfikować ryzyka i optymalizować harmonogram.
Chcesz przenieść planowanie projektów na wyższy poziom? Rozpocznij pracę z Asaną, aby wizualizować osie czasu i śledzić postępy w czasie rzeczywistym.
Wypróbuj integrację Lucidchart + Asana