Processkartläggning: din kompletta guide till tydligare arbetsflöden

Sammanfattning
Processkartläggning hjälper team att se vad som egentligen händer i deras arbetsflöden. Leveransförseningar, missade granskningar och dubbelarbete beror sällan på individer – de beror på otydliga processer. När ingen ser hur hela arbetsflödet hänger ihop kan även enkla uppgifter köra fast.
En processkarta gör det osynliga synligt. Den ger dig en visuell bild av hur arbetet blir gjort, hjälper team att upptäcka flaskhalsar och tydliggör ansvarsområden. I den här guiden går vi igenom vem som använder processkartläggning på jobbet, vilka fördelar den ger, vilka typer av kartor du kan skapa och hur du skapar en karta som hjälper ditt team att arbeta smartare.
Vad är processkartläggning?
Processkartläggning är en metod för att visuellt dokumentera hur arbetet flyter från början till slut. Ett diagram – ofta kallat flödesschema eller arbetsflödesdiagram – visar varje steg, beslutspunkt och överlämning så att team kan förstå, kommunicera och förbättra hur arbetet görs.
Syftet är att kommunicera hur en process fungerar på ett enkelt och tydligt sätt. I stället för att förklara processen muntligt kan du dela kartan. Att kartlägga en process från början till slut gör det enklare att upptäcka vad som fungerar och vad som behöver åtgärdas. Här är några vanliga användningsområden för hur man använder processkartläggning:
lösa återkommande problem
dokumentera komplexa arbetsflöden
Om en specifik process känns rörig eller missförstådd kan en kartläggning av arbetsflödet hjälpa till att klargöra saker och ting för alla.
Vem använder processkartläggning?
Många branscher och roller använder processkartläggning på jobbet, från små team till stora företagsorganisationer. Här är några av de personer som drar mest nytta av den här tekniken:
Business-analytiker använder processkartläggning för att förstå och dokumentera hur affärsprocesser fungerar, identifiera ineffektivitet och rekommendera förbättringar.
Verksamhetschefer använder processkartor för att standardisera arbetsflöden, minska onödigt arbete och förbättra teamsamordningen.
Projektledare skapar processkartor för att planera komplexa initiativ, tydliggöra beroenden och hålla intressenterna informerade.
Personalavdelningen och utbildningsteam använder processkartor för att dokumentera arbetsflöden för introduktion, förklara policyer och hjälpa nyanställda att komma igång snabbare.
IT- och företagsarkitekter kartlägger systemintegreringar och dataflöden för att stödja programvaruutvecklings- och automatiseringsprojekt.
Konsulter använder processkartläggning för att hjälpa kunder att visualisera sitt nuvarande läge och utforma effektivare arbetssätt.
Om ditt team behöver förklara, förbättra eller standardisera hur teamet utför arbetet kan processkartläggning vara till hjälp.
Varför använda en processkarta?
En processkarta omvandlar idéer till tydliga steg som teamet kan följa. Det är ett enkelt sätt att planera arbetet, upptäcka problem och förbättra hur teamet utför saker och ting.
Så här kan processkartläggning vara till hjälp:
Upptäck ineffektivitet. Se var uppgifterna hopar sig, misslyckas eller missas.
Förenkla idéer. Dela upp stora idéer i mindre, hanterbara steg.
Planera för ”tänk om”. Skapa beredskapsplaner och hantera hinder innan de inträffar.
Tydliggör roller. Ange vem som är ansvarig för varje processteg.
Skapa processdokumentation. Bygg en repeterbar guide med hjälp av processdokumentation som alla kan följa.
Kommunicera tydligt. Använd en enkel visuell presentation för att hålla alla informerade.
Fatta beslut snabbare. Mindre kommunikation fram och tillbaka innebär snabbare beslutsfattande.
Stöd ditt team. Hjälp medarbetarna att känna sig trygga i sitt arbete.
Förbli regelefterlevande. Uppfyll standarder som ISO 9000 och ISO 9001 med hjälp av programvara för regelefterlevnad.
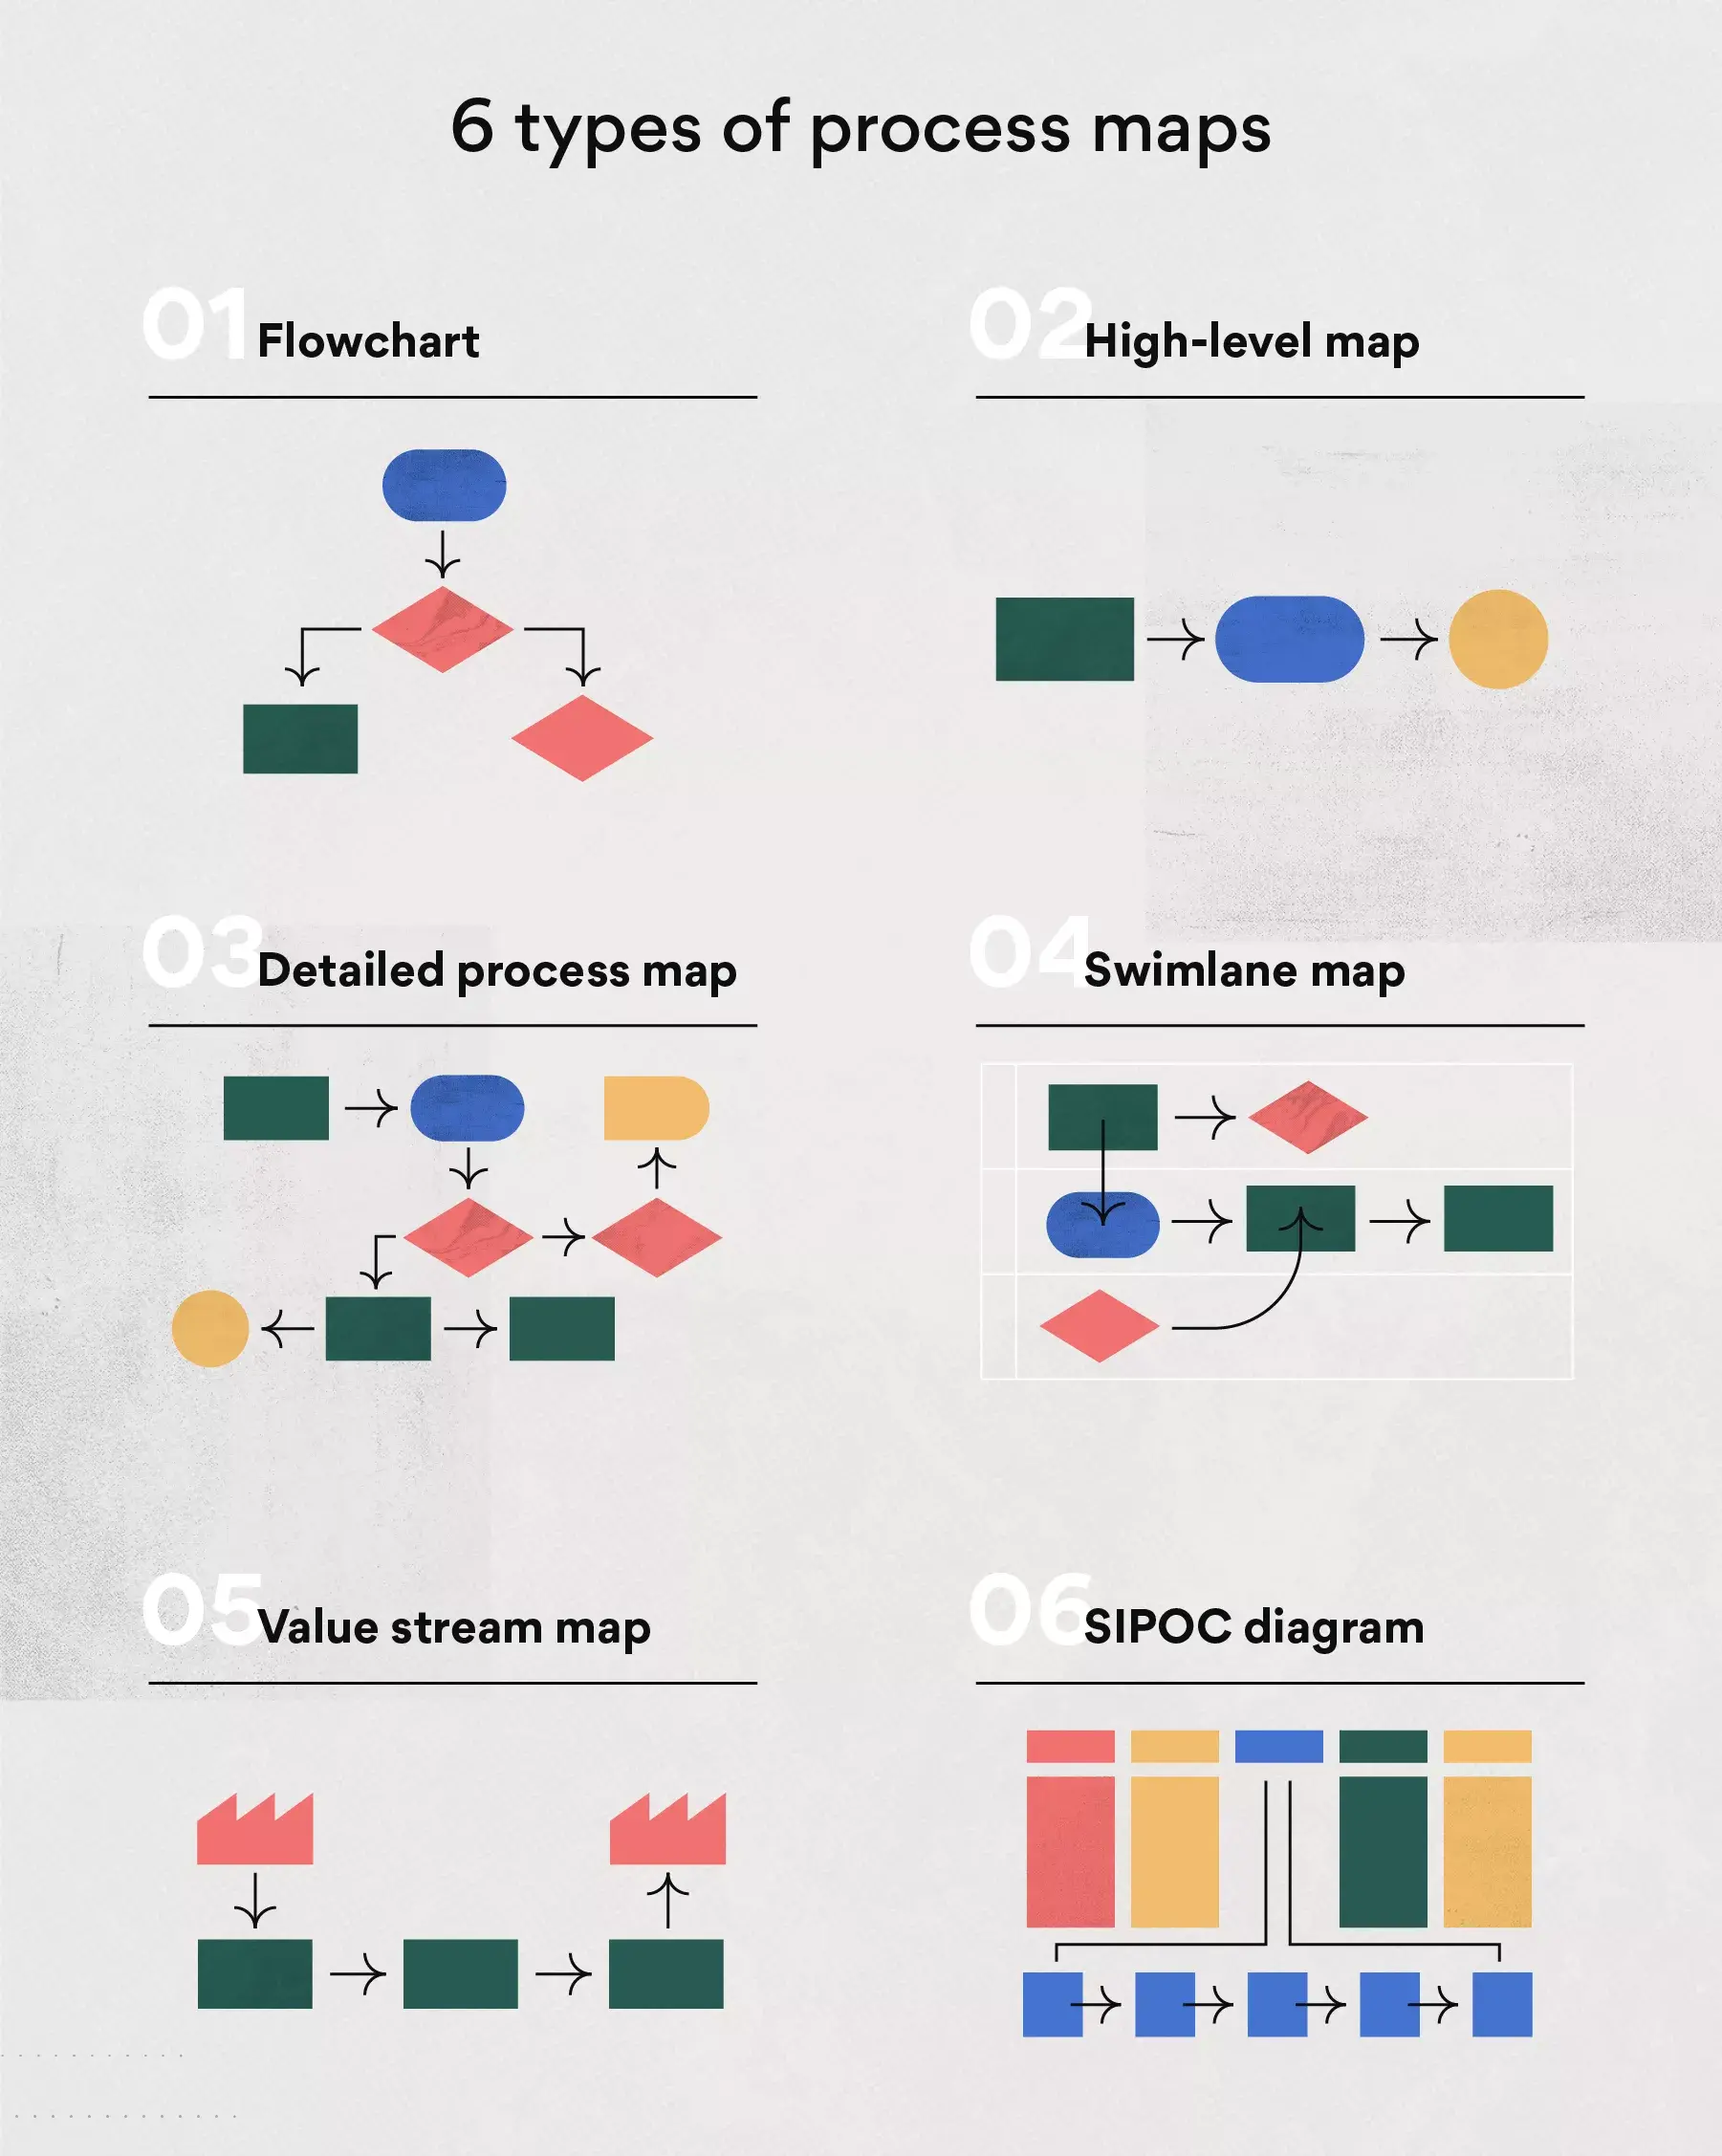
Olika typer av processkartor
Det finns alla möjliga olika sorters processkartor. De tjänar alla samma syfte, men vissa typer kan vara bättre lämpade för särskilda projekt. Här är en snabb jämförelse:
Typ av processkarta | Passar bäst för | Komplexitet |
Flödesscheman | Enkla, sekventiella processer | Låg |
Processkartor på hög nivå | Översikter och omfattningsbedömning för verkställande ledning | Låg |
Detaljerade processkartor | Komplexa arbetsflöden och revisioner | Hög |
Aktivitetsbanekarta | Tvärfunktionella processer | Medel |
Värdeströmskartor | Lean-processförbättring | Hög |
SIPOC-diagram | Omfattning före detaljerad kartläggning | Låg |
BPMN | Automatisering och systemintegrering | Hög |
Här följer en närmare titt på varje typ och när de ska användas.
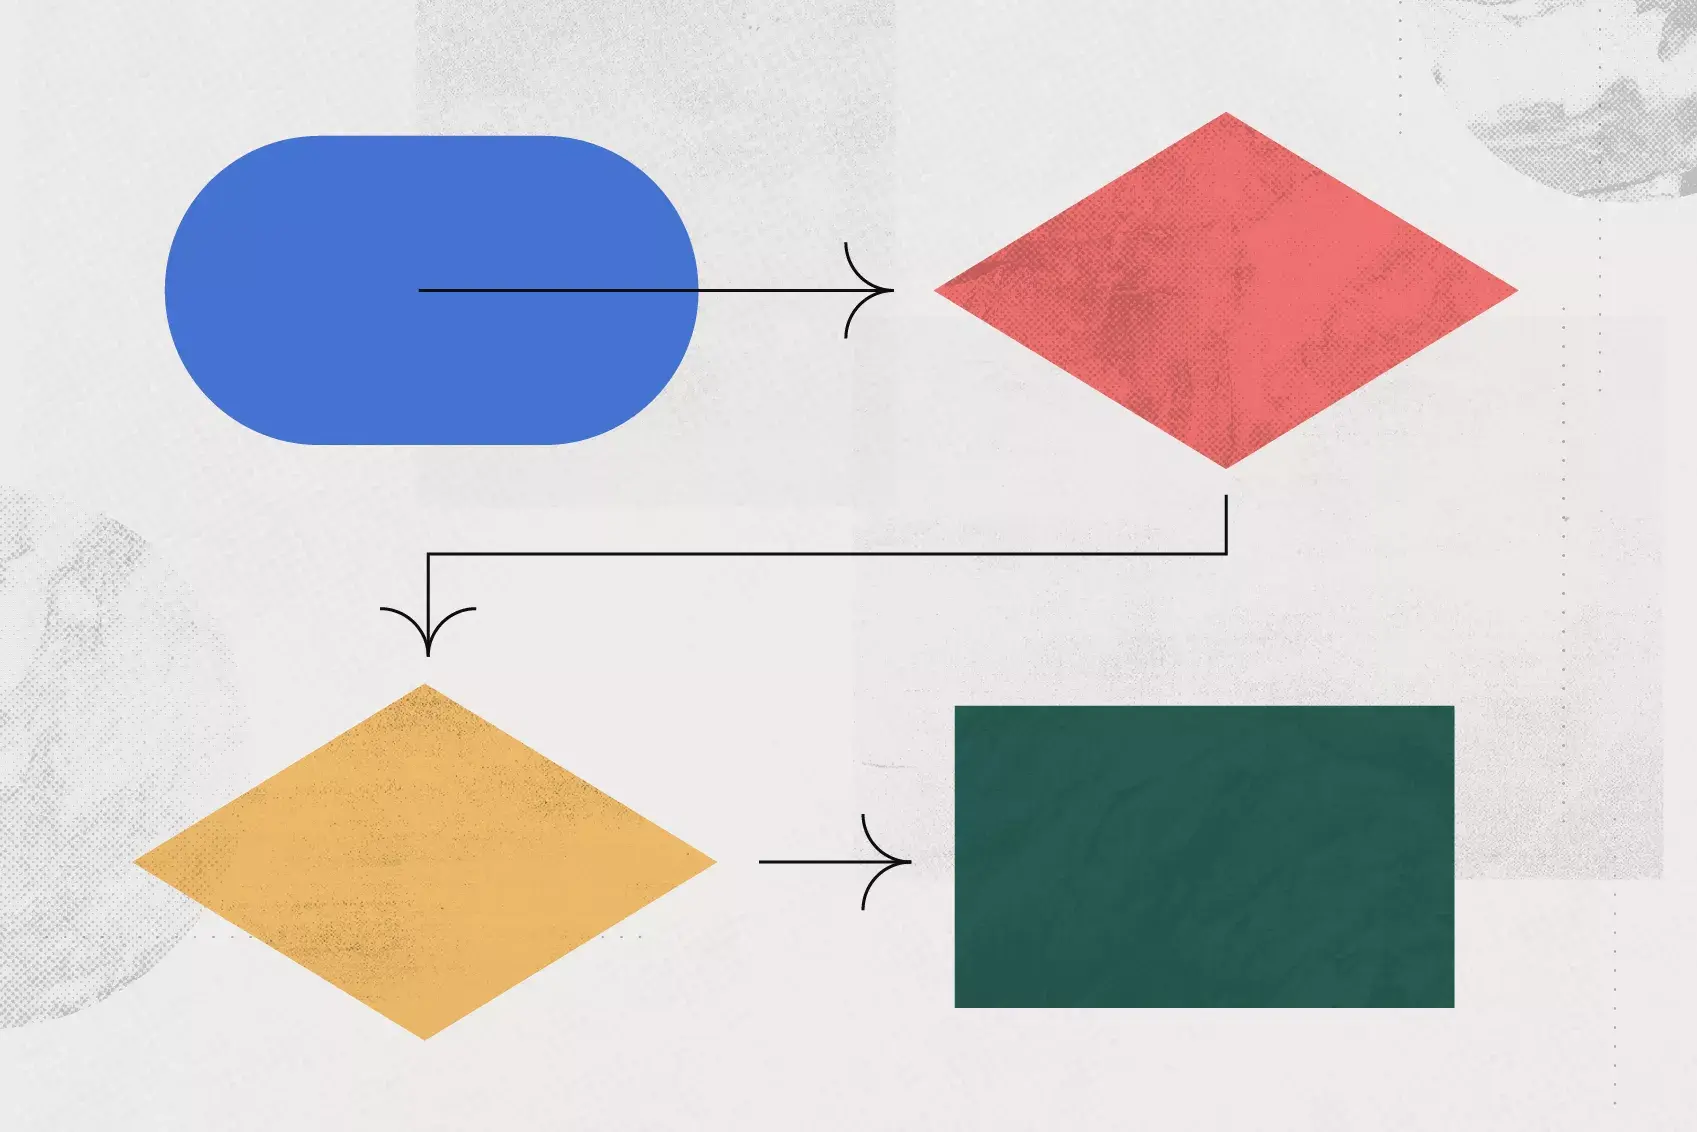
Flödesscheman
Det enkla flödesschemat är den enklaste och mest använda typen av processkarta. Det använder vanliga processkartläggningssymboler för att visa in- och utgångar samt processsteg från början till slut.
planera ett nytt arbetsflöde
lösa problem i en process
förbättra teamkommunikationen.
Det är också en bra utgångspunkt för att dokumentera processer under introduktions- eller brainstormingsessioner.
Bäst för: att visa hur en specifik process flödar från start till slut i tydliga, sekventiella steg.
Processkartor på hög nivå
Den här versionen, som även kallas top-down-kartläggning eller kartläggning av värdekedjan, ger en överblick över en affärsprocess. Den hoppar över de små detaljerna och fokuserar på de viktigaste faserna.
En processkarta på hög nivå är användbar när du:
definiera en ny processstruktur
dela översikter med chefer eller externa partner
fastställa omfattningen innan du skapar en detaljerad karta.
Bäst för: att kommunicera de viktigaste stegen utan att gå in på detaljer.
Detaljerade processkartor
Den här kartan innehåller allt: åtgärder, beslut, delprocesser, indata, utdata, mätvärden och eventualiteter. Den anger ofta tydligt beslutspunkter och visar exakt vem som är ansvarig för vad.
Den är idealisk för att:
analysera komplexa arbetsflöden
upptäcka ineffektivitet eller förseningar
standardisera nya projekt i stor skala.
Bäst för: att ge en fullständig och grundlig bild av hur en process fungerar.
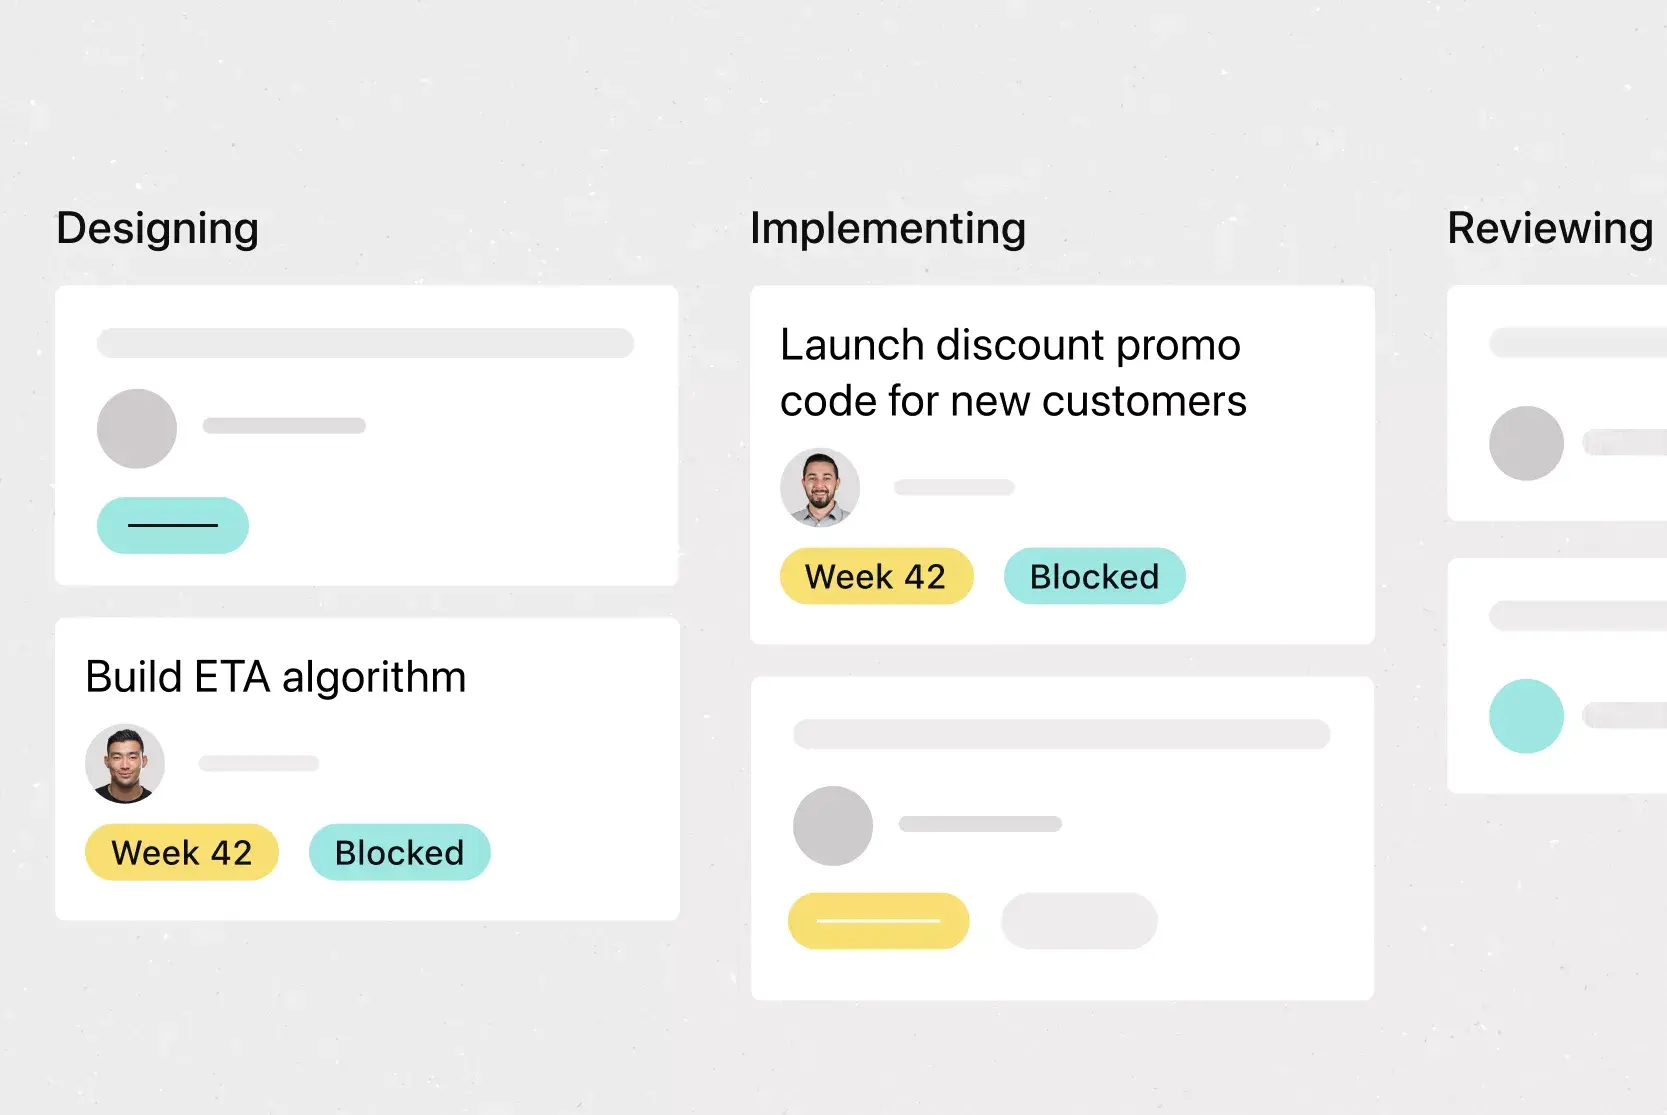
Aktivitetsbanediagram
Ett diagram med aktivitetsbanor (”swimlanes”), även kallat ett tvärfunktionellt flödesschema, organiserar en process genom att dela in ansvarsområden i horisontella eller vertikala ”banor”. Varje körfält representerar en person, en roll eller ett team.
Använd det för att:
markera ansvarstagande
spåra överlämningar mellan avdelningar
förbättra samordningen i tvärfunktionella arbetsflöden
förtydliga roller vid processändringar.
Bäst för: att förtydliga roller och ansvarsområden i processer som involverar flera team.
Värdeströmskarta
Värdeströmskartor används inom lean-hantering som ett verktyg för att spåra hela resan för en produkt eller tjänst, från början till leverans. Den använder en särskild uppsättning kartläggningssymboler för att visa hur information och material rör sig genom varje steg.
Den samlar in data och mätvärden såsom:
cykeltid
antal involverade personer
var slöseri eller förseningar uppstår.
Bäst för: att spåra hur värde levereras till kunderna och hitta möjligheter att minska slöseri.
SIPOC-diagram
Ett SIPOC-diagram står för Suppliers, Inputs, Process, Outputs, Customers (leverantörer, inflöde, process, utflöde, kunder). Det är ett strukturerat diagram, inte en processkarta i flödesstil, som ger en övergripande översikt över ett arbetsflöde innan du skapar en mer detaljerad processkarta.
Använd det här verktyget för processkartläggning tillsammans med Six Sigma-metoden eller någon annan strukturerad processkartläggningsmetod. Var och en av de fem SIPOC-kolumnerna bidrar till att tydliggöra processen och vilka intressenter som är inblandade.
Använd ett SIPOC-diagram för att:
definiera omfattningen av komplexa processer
identifiera alla komponenter och teammedlemmar
sätta tydliga avgränsningar för processförbättringsprojekt.
Bäst för: att beskriva vad som ingår innan hela arbetsflödet kartläggs.
BPMN (Business Process Model and Notation)
BPMN är en standardiserad metod för processkartläggning av verksamhetsprocesser. Den använder unika symboler för att visa hur uppgifter, händelser och beslut flödar, vilket gör det lättare för tekniska och icke-tekniska team att samarbeta.
Den är perfekt för att göra följande:
dokumentera logik mellan olika verktyg eller system
skapa arbetsflöden som kommer att automatiseras senare
stödja programvaruintegreringar eller processutveckling.
Bäst för: att kartlägga strukturerade, ofta automatiserade processer som kräver klarhet i olika system och team.
Symboler för processkartläggning
Processkartor använder ett gemensamt visuellt språk för att visa hur arbetet går från ett steg till ett annat. Dessa symboler, som härstammar från Unified Modeling Language (UML), hjälper dig att visa nyckelelement som uppgifter, beslut och förseningar.
Här är de vanligaste symbolerna för processkartläggning och vad de betyder:
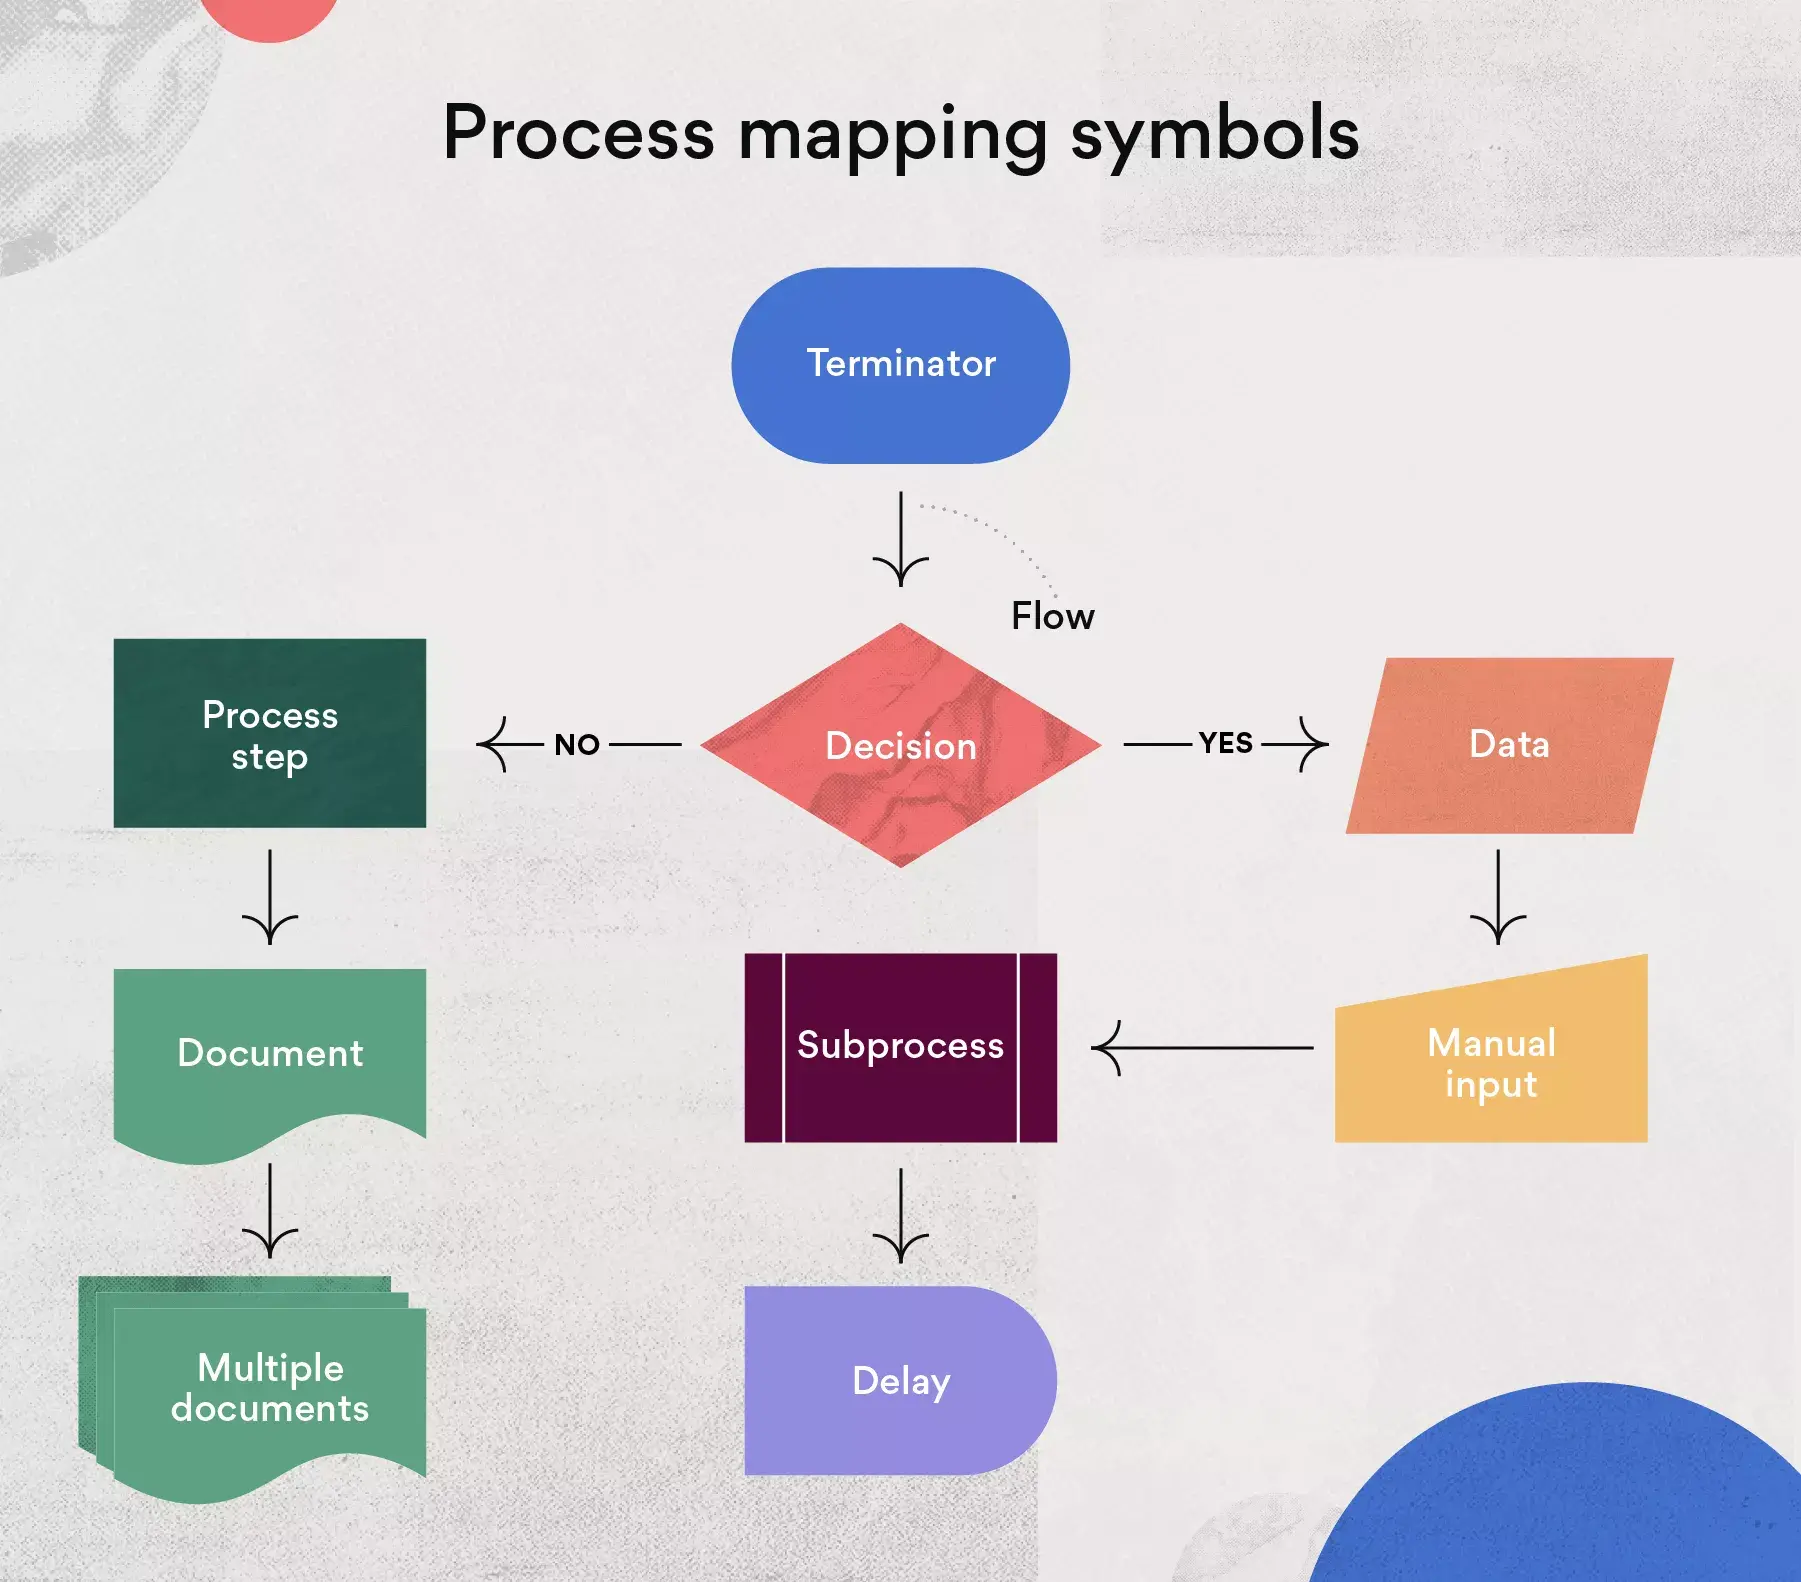
Symbolnamn | Form | När man ska använda den |
Start/slut | Oval | Markerar start eller slut i en process |
Processteg | Rektangel | Visa en särskild uppgift eller åtgärd i arbetsflödet |
Flöde | Pil | Kopplar ihop steg och visar arbetets riktning |
Beslut | Ruta | Anger en beslutspunkt med flera utfall |
Försening | D-form | Visa var en paus eller fördröjning inträffar |
Dokument | Rektangel med vågig undersida | Representerar ett läsbart dokument eller en läsbar fil |
Data | Parallellogram | Visar dataflödet in i eller ut ur ett steg |
Manuell inmatning | Rektangel med sned övre kant | Visar var någon måste ange data manuellt |
Delprocess | Rektangel med dubbla vertikala linjer | Representerar en fördefinierad process som sker någon annanstans |
Det här är de grundläggande symbolerna som du kommer att använda oftast. Det finns andra symboler som du kan lägga till när dina kartor blir mer avancerade, men den här uppsättningen är en bra utgångspunkt.
Skapa en mall för processkartläggningSå här skapar du en processkarta
Du skapar en processkarta i sex steg: (1) välj en process, (2) lista aktiviteter och ansvariga, (3) fastställ ordningsföljden, (4) rita flödesschemat, (5) granska med teamet och (6) identifiera förbättringar.
Oavsett om du vill lära dig hur man använder processkartläggning för första gången eller förfina en befintlig process kan du skapa en processkarta med penna och papper, på en whiteboardtavla eller med hjälp av programvara för processkartläggning. Det finns färdiga mallar, men om du lär dig att kartlägga en process från grunden får du kontroll över varje steg.
Steg 1: Välj en process att kartlägga
Välj den specifika process du vill kartlägga. Det kan vara något som är rörigt, ineffektivt eller helt enkelt otydligt för dina teammedlemmar. Det kan vara en ny process som du behöver förklara eller en komplex process som förvirrar människor. Välj en process och ge den ett enkelt namn.
Steg 2: Gör en lista över alla relaterade aktiviteter och personer
Börja med att skriva ner varje uppgift i processflödet. Du behöver inte tänka på ordningsföljden ännu. Lista alla indata, åtgärder och vem som är ansvarig för varje aktivitet.
Arbeta tillsammans med ditt team och andra intressenter för att:
upptäcka viktiga delprocesser
bestämma hur många detaljer som ska ingå
tydligt markera startpunkten och slutpunkten.
Steg 3: Fastställ stegens ordningsföljd
Ta nu den listan och ordna uppgifterna i rätt ordning. Gå igenom den nuvarande processen från början till slut och lägg till eventuella steg som du missade tidigare. Detta ger dig en fullständig bild av arbetsflödet.
Steg 4: Rita flödesschemat
Välj det format som passar bäst. Beroende på detaljnivån och typen av process kan du välja mellan följande alternativ:
grundläggande flödesschema
aktivitetsbanediagram
värdeströmskartor
BPMN-diagram.
Använd vanliga symboler för processkartläggning för att markera beslutspunkter, åtgärder och kopplingar. Ett verktyg som Asana gör det enkelt att skapa och dela din processkarta digitalt med hela teamet.
Läs: Fyra typer av konceptkartor (med kostnadsfria mallar)Steg 5: Granska med teamet
Gå igenom processflödesschemat med alla inblandade. Se till att hela processen är korrekt. Fråga om några steg saknas, om några uppgifter upprepas eller om något verkar otydligt. Åtgärda eventuella misstag. Dela sedan den slutliga versionen med dina teammedlemmar och alla andra som behöver den.
Steg 6: Leta efter problem och förbättra processen
Nu när din karta återspeglar det nuvarande läget kan du använda den som ett verktyg för processförbättring. Håll utkik efter flaskhalsar, brister och onödiga steg. Fråga teamet var de fastnar eller blir förvirrade.
Därefter kan du optimera processen genom att ta bort steg, omfördela uppgifter eller lägga till automatisering. Uppdatera processkartan så att den återspeglar ändringarna. Så här sker kontinuerlig förbättring: kartlägg processen, åtgärda den, upprepa.
Exempel på processkartläggning
Du kan skapa en processkarta för alla typer av processer, men du kanske fortfarande undrar hur du ska använda det här verktyget i ert team.
Här är ett exempel för att du ska få en bättre uppfattning om hur en processkarta kan se ut:
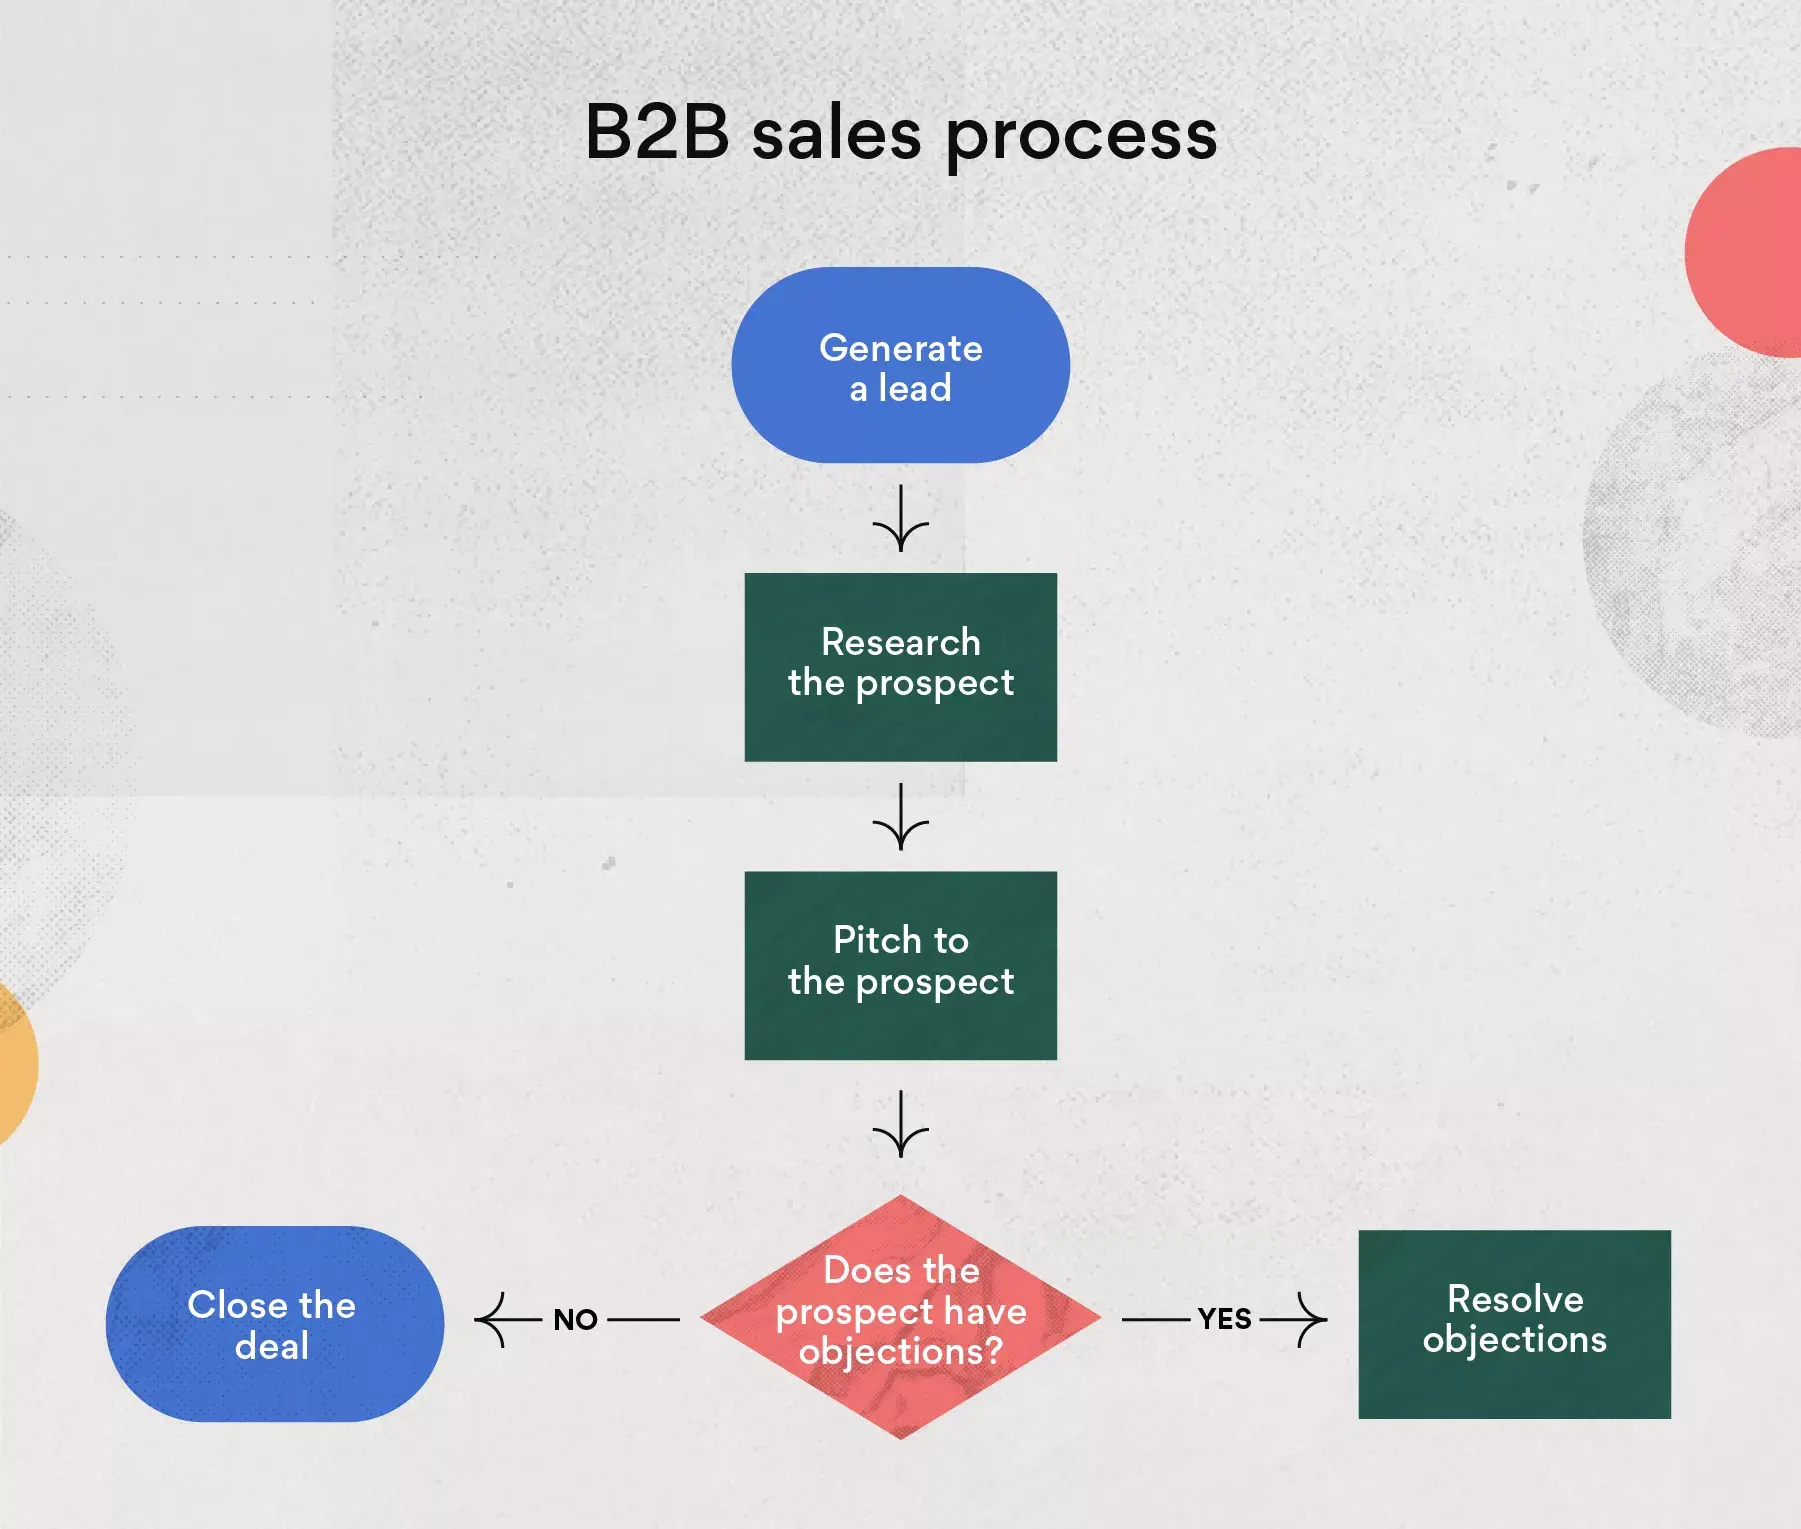
Utöver försäljningsprocesser finns det många andra situationer där exempel på processkartläggning kan vara användbara. Här är tre vanliga scenarier:
Onboarding av nyanställda
En processkarta för onboarding visar hela resan från det att en ny medarbetare signerar sitt avtal till att personen är helt självgående i sin roll. Flödet börjar med att HR skickar välkomstinformation, följt av IT som förbereder utrustning och konton. Därefter tar teamledaren vid med introduktionsmöten, utbildning och en första veckas checklista. Genom att kartlägga dessa steg undviker du att nya medarbetare faller mellan stolarna.
Marknadsföringskampanj
En processkarta för en marknadsföringskampanj täcker arbetsflödet från brief till publicering och uppföljning. Processen startar med att en brief skapas och godkänns, sedan går den vidare till innehållsproduktion, design och granskning. Efter godkännande schemalägger teamet publicering i valda kanaler och samlar sedan in resultat för uppföljning. Kartan gör det tydligt vem som äger varje steg och var överlämningarna sker.
IT-supportärende
En processkarta för IT-support visar hur ett ärende rör sig från att en medarbetare rapporterar ett problem till att ärendet är löst och stängt. Flödet inkluderar ärenderegistrering, prioritering, tilldelning till rätt tekniker, felsökning och lösning. Om teamet inte kan lösa problemet på första nivån eskalerar de det vidare. Kartan hjälper teamet att identifiera var ärenden fastnar och hur svarstiderna kan förbättras.
Metoder för processkartläggning
Du kan anpassa processkartan efter teamets behov, men det finns viss bästa praxis som kan hjälpa dig att skapa tydliga och effektiva kartor redan från början.
Här är några bästa praxis för processkartläggning för att få ut så mycket som möjligt av varje fas.
1. Planera innan du kartlägger
Fastställ omfattningen. Fastställ start- och slutpunkterna så att din karta endast innehåller det som är nödvändigt.
Klargör ditt mål. Var medveten om vad du vill uppnå med processen.
Fokusera på resultaten. Kartlägg endast processer som har ett tydligt, mätbart resultat.
2. Skapa din karta med avsikt
Arbeta baklänges. Börja med det önskade slutresultatet och kartlägg sedan stegen baklänges.
Förenkla där det är möjligt. Se till att delprocesserna är lätta att följa.
Inkludera rätt mängd detaljer. Komplicera inte för mycket, men lämna inte några luckor.
Använd standardsymboler. Håll dig till vanliga symboler för processkartläggning för att säkerställa en gemensam förståelse.
3. Granska och förfina
Få feedback. Involvera alla som spelar en roll i processen.
Ta hänsyn till alternativa vägar. Om det finns mer än ett sätt att nå målet ska du inkludera alla dessa alternativ.
Kartlägg verkligheten, inte idealet. Visa hur processen faktiskt fungerar i dagsläget och gör sedan förbättringar därifrån.
Tillämpa de här tipsen under arbetets gång, från planering till granskning, för att skapa processkartor som är tydliga, användbara och redo att leda till verkliga förbättringar.
Börja med processkartläggning, börja med förbättringar
Processkartläggning ger dig kontroll över hur teamet faktiskt utför arbetet. Genom att visualisera varje steg kan du identifiera flaskhalsar, förtydliga ansvarsområden och skapa arbetsflöden som fungerar i praktiken. Det är ett av de mest effektiva verktygen för att gå från otydlighet till handling.
Med Asanas kostnadsfria mall för processkartläggning kan du visualisera dina arbetsflöden, upptäcka vad som bromsar dig och skapa klarhet i varje steg. När du har kartlagt din process kan du använda Asana för att hålla arbetet i gång, tilldela uppgifter, spåra förlopp och hålla alla samordnade från början till slut. Kom igång med Asana.
Skapa en mall för processkartläggning