Modelo de mapa conceitual: use o mapeamento conceitual para organizar ideias complexas

Resumo
Ao iniciar um projeto, não há nada mais importante do que garantir que toda a equipe esteja em sintonia. Todos precisam trabalhar com as mesmas informações, e você precisa ter certeza de que todos os membros da equipe entendem essas informações corretamente. Mal-entendidos e falhas de comunicação podem atrasar e até mesmo interromper o progresso, o que pode custar tempo e dinheiro ao projeto.
Uma das melhores maneiras de garantir que todos estejam em sintonia é com um mapa conceitual. Os mapas conceituais são diagramas que ajudam a visualizar as informações de uma maneira que todos possam entender. Você pode usar um mapa conceitual para visualizar um fluxo de trabalho, dividir ideias complexas ou mapear as diferentes partes de um sistema de projeto para ver como as tarefas funcionam juntas.
Qualquer pessoa pode fazer um mapa conceitual, mas é aconselhável primeiro conhecer as diferentes estruturas de mapa e a melhor forma de usá-las.
O que é um mapa conceitual?
Um mapa conceitual é um diagrama visual que organiza as informações. Os mapas conceituais podem representar praticamente qualquer coisa, como um processo, um grupo de ideias e conceitos ou um sistema de partes inter-relacionadas. Você pode usar um mapa conceitual para registrar as etapas de um fluxo de trabalho de desenvolvimento de produtos, criar um gráfico visual das pessoas da sua empresa ou mapear como os departamentos de marketing e vendas colaboram de forma eficaz.
Os mapas conceituais não são úteis apenas nos negócios: os engenheiros os usam para traçar os componentes do sistema, os educadores os usam para ensinar diferentes ideias e os cientistas os usam para rastrear os principais detalhes de seus assuntos à medida que fazem novas descobertas.
Vantagens de usar mapas conceituais
Quando ideias complexas parecem esmagadoras, os mapas conceituais fornecem um caminho claro para a compreensão. Essas ferramentas visuais ajudam a estruturar pensamentos e simplificar o processo de tomada de decisão. Se você está trabalhando em um projeto ou tentando resolver um problema, um mapa conceitual traz ordem ao caos. Veja por que eles são tão eficazes:
A representação visual dos principais conceitos e relações permite que você veja o panorama geral.
A divisão clara de informações complexas leva a sessões de brainstorming mais produtivas.
A estrutura melhora a tomada de decisões e estimula as habilidades de resolução de problemas.
Opções como mapas de aranha, mapas de bolhas e diagramas de Venn oferecem versatilidade.
As equipes colaboram de forma mais eficaz usando mapas interativos para contribuições compartilhadas.
Usar modelos de mapa conceitual gratuitos poupa tempo e ajuda a começar rapidamente.
Portanto, se você está cansado de ideias dispersas ou com dificuldade para conectar os pontos, um mapa conceitual é a ferramenta perfeita para ajudar a se organizar e manter o foco.
Quando usar um modelo de mapa conceitual
Se você se sentir preso tentando lidar com o seu próximo projeto ágil ou organizar os seus pensamentos, um modelo de mapa conceitual pode simplificar o processo. Em vez de encarar um mapa conceitual em branco ou um novo pacote de notas adesivas, comece o seu trabalho usando um modelo para estruturar as suas ideias.
Considere usar um modelo de mapa conceitual nestas situações:
Você precisa lidar com conceitos complexos ou ter ideias criativas de brainstorming.
O seu planejamento envolve a criação de fluxos de trabalho para a gestão de projetos ou requer a contribuição das partes interessadas.
Você precisa de um método claro de planejamento de projetos para monitorar etapas e fluxos de trabalho, como um modelo de diagrama de fluxo de trabalho.
Você está preparando infográficos, documentos ou apresentações e quer uma ferramenta visual organizada para exibir conceitos relacionados.
Se você está se sentindo sobrecarregado pela complexidade das suas ideias, um modelo de mapa conceitual pode ajudar a desvencilhar-se e seguir em frente com confiança.
Quatro tipos de modelos de mapa conceitual
Há muitas estruturas e formatos diferentes que podem ser usados para criar um mapa conceitual. Os quatro tipos mais populares são:
Mapas de aranha, usados para diagramar conceitos.
Fluxogramas, usados para visualizar processos.
Mapas de hierarquia, usados para visualizar organizações.
Mapas de sistemas, usados para visualizar sistemas.
Embora existam outros tipos de mapas conceituais, quase tudo pode ser mapeado usando uma dessas quatro estruturas.
![[ilustração embutida] Tipos comuns de mapas conceituais (infográfico)](https://assets.asana.biz/transform/c9e443ea-326d-4a08-b14d-3ec789107920/inline-business-strategy-concept-map-template-1-2x?io=transform:fill,width:2560&format=webp)
1. Mapas de aranha
Um mapa de aranha é um tipo de mapa conceitual que começa com um conceito-chave e se ramifica em ideias relacionadas. Também chamados de mapas mentais ou teias de ideias, os mapas de aranha são úteis para orientar sessões de brainstorming ou organizar pensamentos, pois permitem ver as relações entre as ideias de relance.
Como usar um mapa de aranha
Para criar um mapa de aranha, comece desenhando um círculo no centro de uma folha de papel ou em um quadro branco. Escreva a ideia central no círculo, depois desenhe linhas a partir dele e rotule-as com conceitos relacionados. Continue adicionando conceitos (e subconceitos) até ter uma rede de ideias que cubra a página.
Mapa mental básico gratuitoQuando usar um mapa mental
Como os mapas de aranha são frequentemente usados durante as fases de brainstorming e “esboço” do planejamento, muitas pessoas preferem criá-los à mão em papel ou em conjunto em um quadro branco. Os mapas de aranha geralmente não acabam sendo publicados ou compartilhados com a empresa em geral, por isso não é tão importante garantir que esse tipo de mapa conceitual esteja organizado e bem formatado. No entanto, você pode usar o modelo de mapa mental acima para começar com um conjunto inicial de nós do mapa.
2. Fluxogramas
Um fluxograma é um tipo de diagrama que ajuda a visualizar as etapas de um processo. Eles podem ser usados para ilustrar uma ampla variedade de processos, desde tarefas simples, como preencher um pedido de compra, até sistemas complexos, como contabilidade financeira.
Os fluxogramas são frequentemente usados em Business e engenharia, mas podem ser úteis em qualquer situação em que você precise visualizar um processo passo a passo. A chave para criar um fluxograma eficaz é usar formas de fluxograma universalmente reconhecidas que indiquem o que cada etapa do seu fluxo de trabalho significa. Os símbolos mais comuns são:
Oval para os pontos de partida e de chegada
Retângulos para processos
Losangos para decisões
Paralelogramos para entradas e saídas
Linhas de fluxo que conectam formas e indicam a ordem e a direção do fluxo de trabalho
Há também símbolos padrão para documentos, entradas manuais, etapas de preparação, armazenamento de dados, ciclos e atrasos. Ao usar essas formas bem reconhecidas, você pode garantir que qualquer pessoa que olhe para o seu fluxograma será capaz de lê-lo, mesmo sem você lá para explicá-lo.
Como os fluxogramas têm estruturas muito diferentes dependendo do fluxo de trabalho específico que contêm, usar um modelo de papel não é a maneira mais eficiente de criar um. Em vez disso, use uma ferramenta virtual para criar o seu fluxograma. Em seguida, dê vida a ele com um software de gestão de fluxo de trabalho.
3. Mapas hierárquicos
Se você já viu o organograma da sua empresa ou trabalhou na sua própria árvore genealógica, então já está familiarizado com o conceito de mapa hierárquico. Esses mapas organizam os conceitos em uma estrutura hierárquica, do mais geral ao mais específico. Por exemplo, um organograma de empresa normalmente coloca as pessoas com maior autoridade — os fundadores e executivos de nível C — no topo do mapa, e depois prossegue em níveis descendentes até chegar àqueles na parte inferior, que têm as descrições de trabalho mais restritas.
Como usar um mapa conceitual hierárquico
Embora os mapas hierárquicos sejam mais frequentemente usados para organizar pessoas, eles também podem ajudar a dividir as informações em um sistema organizado de partes menores e mais gerenciáveis. Se você criou um mapa hierárquico para traçar esta publicação, por exemplo, pode começar com “mapas conceituais” no topo, colocar cada tipo de mapa conceitual em sua própria caixa de segundo nível e, em seguida, colocar detalhes sobre cada mapa conceitual no nível inferior.
Mapa de hierarquia básico gratuitoO tamanho e a forma do seu mapa hierárquico dependerão de quantos níveis de informação você tiver. Você pode usar o modelo acima para criar uma estrutura hierárquica de três níveis com o tópico principal no topo, até cinco subtópicos no segundo nível e, em seguida, detalhes para cada subtópico nas caixas abaixo. Você também pode usar cores ou símbolos para indicar diferentes níveis de importância.
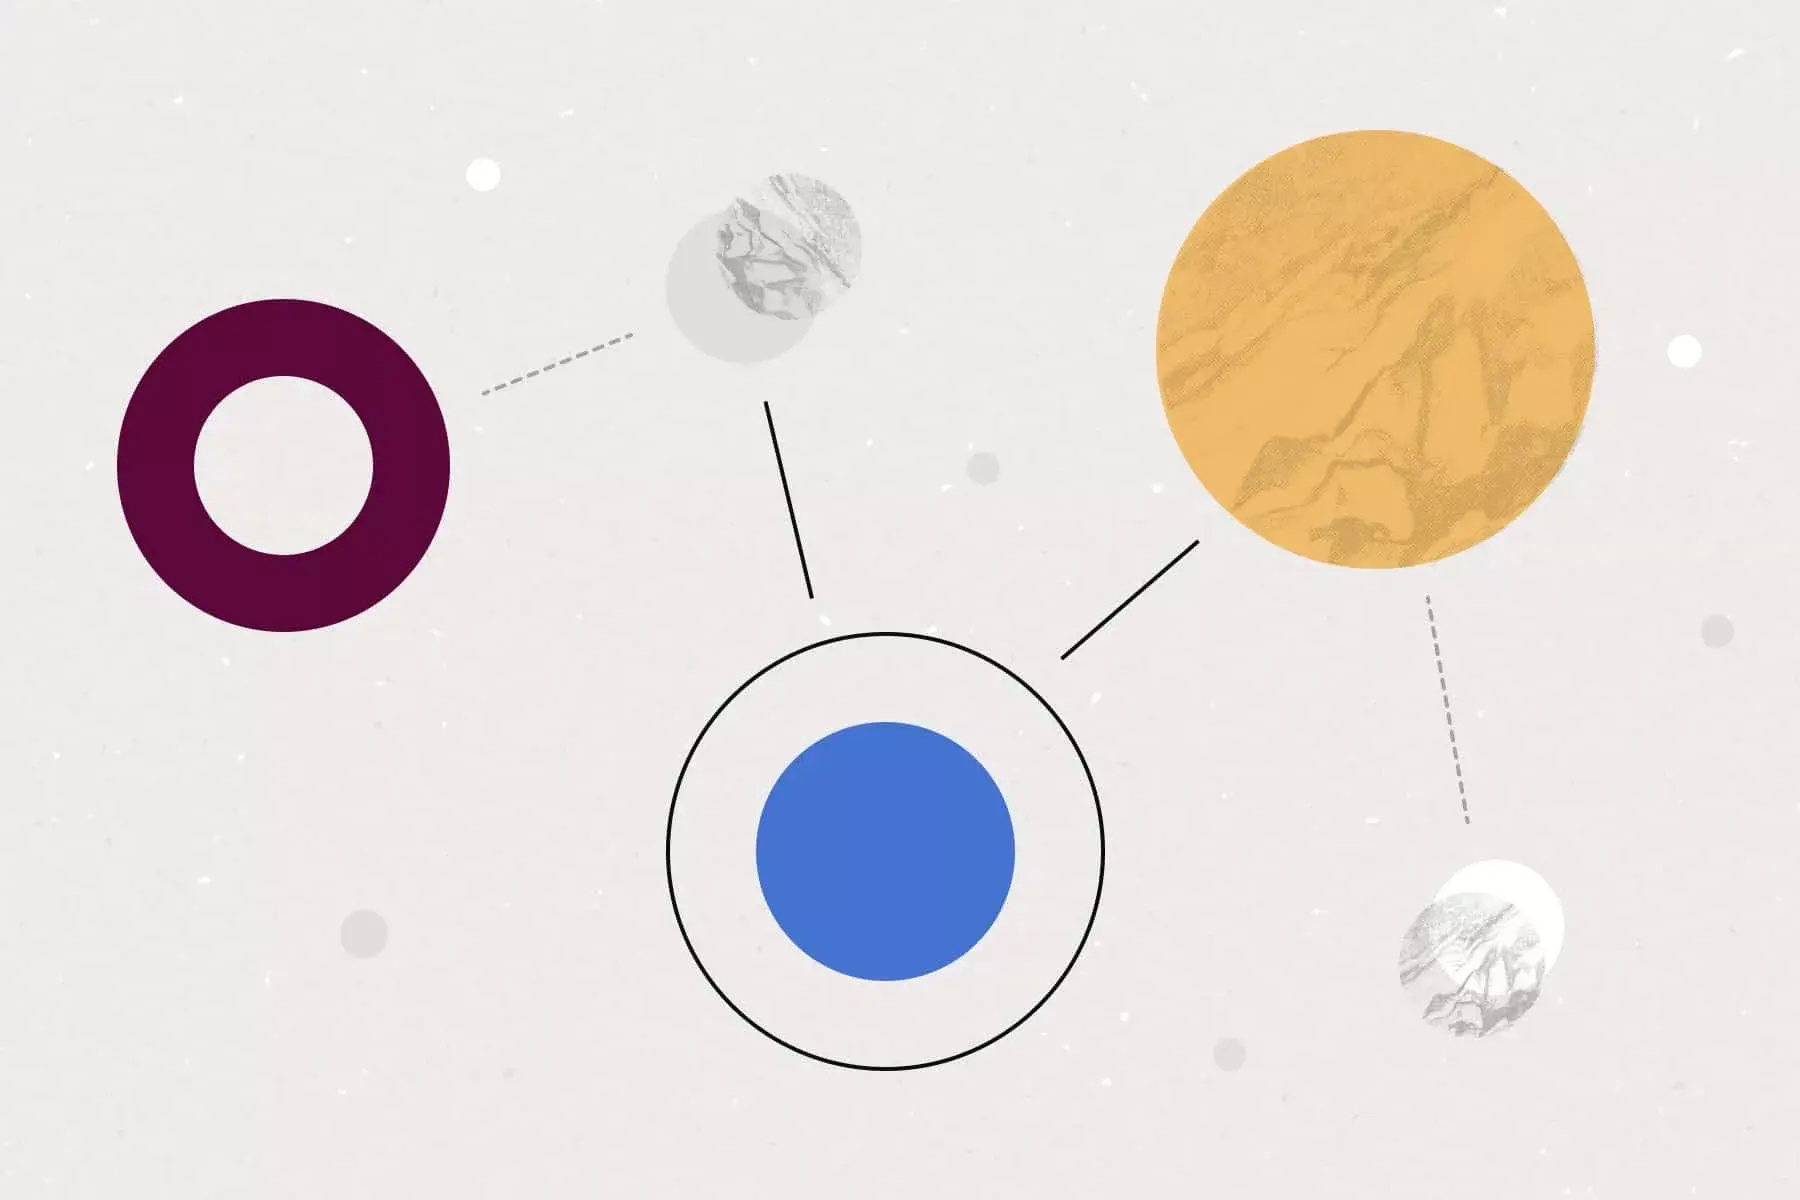
4. Mapas de sistema
Os mapas de aranha organizam ideias e os fluxogramas organizam processos. Os mapas de sistema combinam essas duas coisas para mostrar os componentes de uma organização e como eles interagem entre si. Você pode usar um mapa do sistema para ilustrar sistemas simples, como uma impressora, ou sistemas mais complexos, como uma empresa com vários departamentos e equipes.
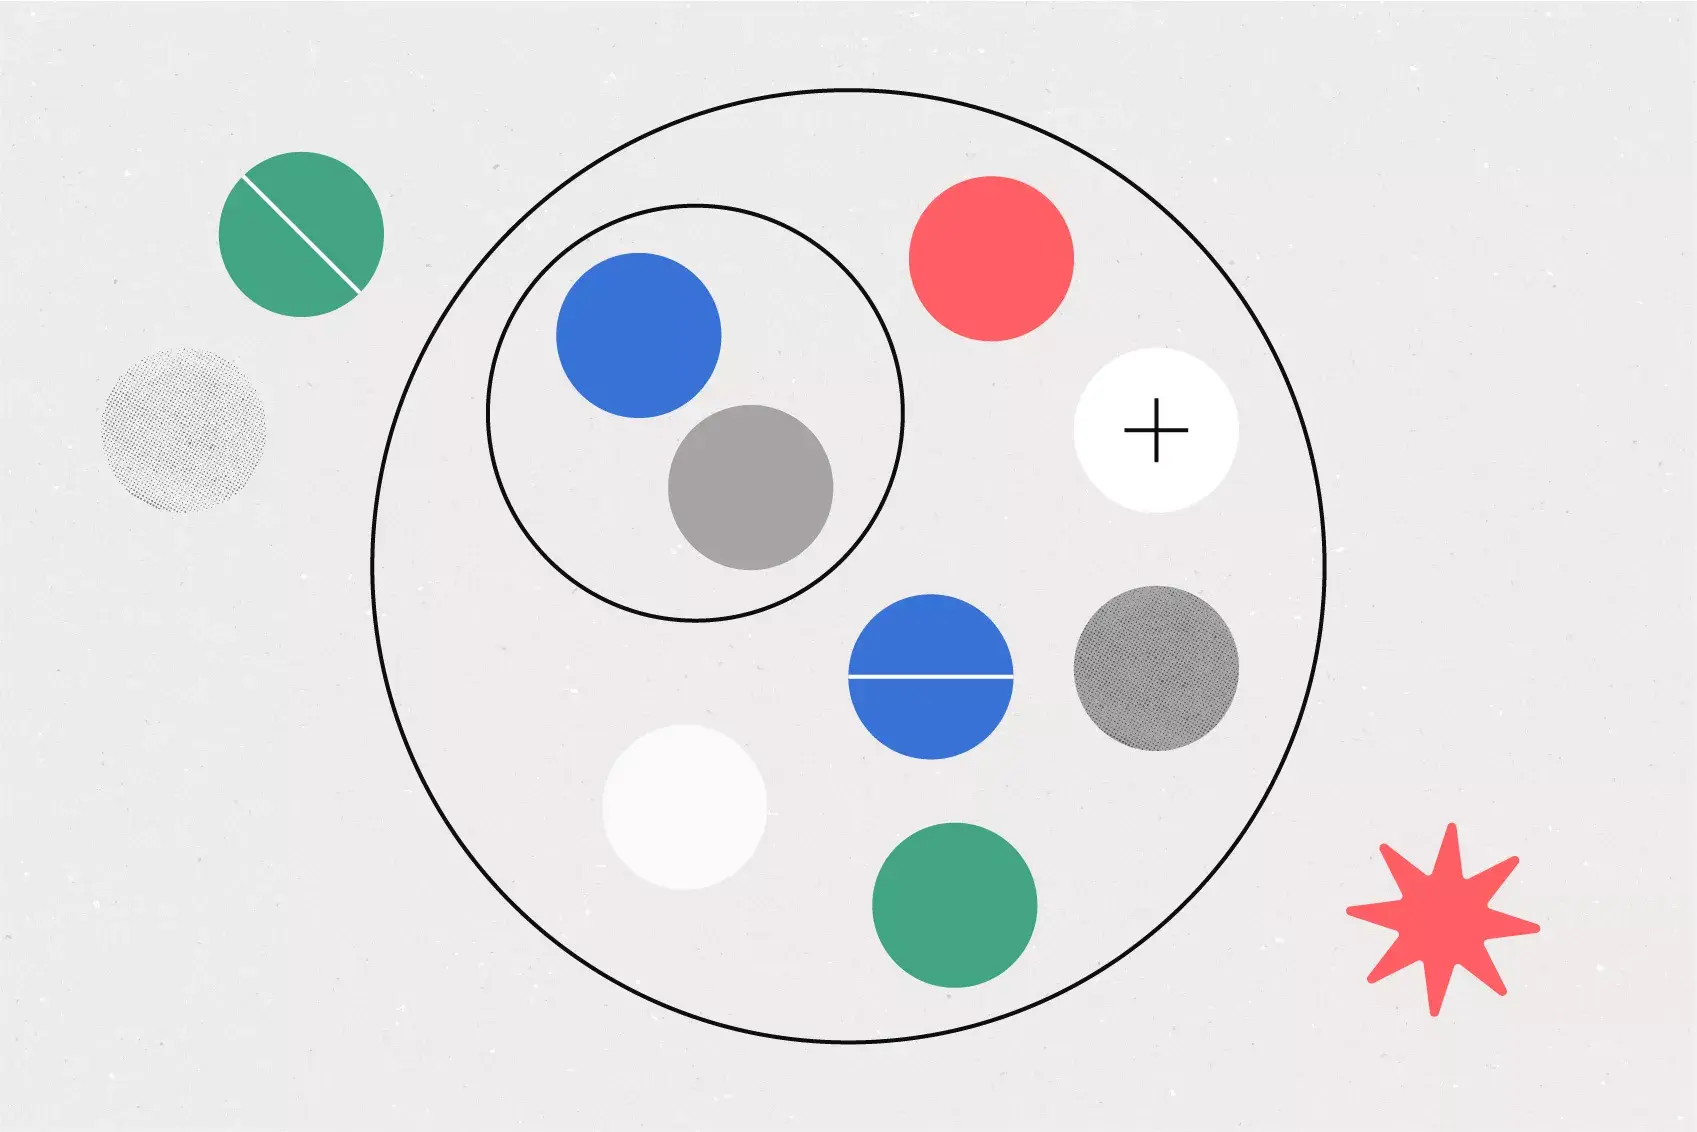
Um mapa do sistema é separado em duas seções principais: tudo dentro do círculo maior é o sistema, e tudo fora do círculo é o ambiente do sistema. Para mapear o seu sistema, comece adicionando cada componente do sistema dentro do círculo maior e cada componente do ambiente fora dele. O modelo abaixo pode ajudar a começar.
Mapa básico do sistema gratuitoComo usar um mapa do sistema
Digamos que você queira criar um mapa do sistema para a sua empresa. Você começaria criando círculos dentro do círculo do sistema para cada departamento da sua organização. Neste exemplo, usaremos contabilidade e RH. Dentro do departamento de contabilidade, você criaria círculos menores para diferentes equipes, como folha de pagamento, orçamentos e faturamento. O departamento de RH também teria uma equipe de folha de pagamento, além de outras como integração, gestão de crises e benefícios para os funcionários. Se apenas uma equipe lida com todas essas coisas, tudo bem também. Não há uma quantidade mínima ou máxima de elementos necessários para cada círculo.
Fora do círculo do sistema, você adicionaria componentes no ambiente da sua empresa, como clientes e terceirizados, que afetam e interagem com a sua empresa, mas não fazem parte dela.
Depois de registrar os componentes, você precisa adicionar os processos. São linhas que conectam diferentes componentes do sistema com rótulos que nomeiam o processo que os conecta. As linhas de processo podem abranger diferentes níveis e conectar componentes dentro e fora do sistema. Você também pode ter dois componentes conectados por dois processos que funcionam em direções opostas.
Exemplo de mapa do sistema
Por exemplo, o processo de folha de pagamento envolve os departamentos de contabilidade e RH, e o processo flui em ambas as direções. A equipe de RH integra novos funcionários e os adiciona ao sistema de folha de pagamento, depois envia o salário de cada novo funcionário e as informações de depósito direto para a contabilidade, que é quem realmente envia os contracheques. Na direção oposta, a equipe financeira envia informações sobre o orçamento disponível para aumentos e negociações salariais para o RH, que lida com contratações e promoções.
Continue adicionando componentes e conectores de processo até ter uma imagem completa do sistema. Você também pode usar símbolos para representar diferentes tipos de interações, como os diferentes fluxos de energia, informações ou recursos.
Crie um mapa conceitual hoje
Os nossos modelos gratuitos ajudam a organizar e colaborar
Como usar um modelo de mapa conceitual
Usar um modelo de mapa conceitual é uma maneira simples de organizar os seus pensamentos, visualizar ideias complexas e transformar o brainstorming em etapas práticas. Seja usando um criador de mapas conceituais ou um modelo pré-definido, o processo é intuitivo.
Vejamos um exemplo de organização de um fluxo de trabalho de gestão de projetos. Aqui está um guia passo a passo para começar:
Etapa 1: escolha o modelo certo
O primeiro passo é selecionar um modelo de mapa conceitual que atenda às suas necessidades. Se você estiver planejando um fluxo de trabalho de gestão de projetos, escolha um modelo projetado para descrever processos, como um modelo de diagrama de fluxo de trabalho. Esse tipo de modelo permite mapear tarefas, responsabilidades e marcos, criando uma visão geral funcional do seu projeto.
Exemplo: para um projeto que envolva vários membros da equipe, um modelo de diagrama de fluxo de trabalho ajuda a visualizar o fluxo de tarefas de um departamento para outro, garantindo que todas as etapas sejam claras.
Etapa 2: defina o conceito principal
Depois de escolher o modelo, comece identificando o conceito central ou a ideia principal. Este é o núcleo do seu mapa, e todo o resto se ramificará a partir dele. No nosso exemplo de gestão de projetos, o conceito central poderia ser “fluxo de trabalho do projeto”.
Exemplo: no centro do mapa, identifique o nó principal como “fluxo de trabalho do projeto”. A partir daqui, você pode ramificar para as diferentes fases do projeto, como “Planejamento”, “Execução” e “finalização”.
Etapa 3: adicione os principais conceitos e subtópicos
Em seguida, adicione os ramos primários que se estendem a partir do conceito principal. Essas ramificações representam os principais conceitos ou estágios relacionados à ideia principal. Divida cada conceito-chave em subtópicos ou tarefas menores.
Exemplo: em “Planejamento”, você pode criar subtópicos como “Definir metas”, “Atribuir funções” e “Definir prazos”. Cada subtópico deve definir claramente as etapas acionáveis e servir como foco para o seu processo de ideação.
Etapa 4: conecte os conceitos relacionados
Agora que você tem os principais conceitos e subtópicos, é hora de mostrar as relações entre eles. Use linhas ou setas para conectar conceitos relacionados e destacar o fluxo de tarefas ou informações entre cada estágio.
Exemplo: você pode conectar “Atribuir funções” na fase de planejamento a “Execução” para mostrar como as funções da equipe afetam a próxima etapa do projeto. Isso ajuda a esclarecer como uma parte do fluxo de trabalho afeta a próxima, fazendo com que o projeto seja executado sem problemas em todo o espaço de trabalho.
Etapa 5: revise e refine
Por fim, revise o mapa conceitual para garantir que tudo flua de forma lógica e que todos os principais conceitos estejam representados. Esta é a sua oportunidade de fazer ajustes, como adicionar detalhes ou reorganizar etapas para maior clareza.
Exemplo: após a revisão, talvez você perceba que precisa adicionar uma ramificação em “Execução” para “Monitorar o progresso”. Refinar o mapa garante que o fluxo de trabalho do projeto seja completo e esteja pronto para uso.
Ao seguir estas etapas, você pode transformar qualquer modelo de mapa conceitual em uma ferramenta valiosa para organizar ideias, simplificar informações complexas e melhorar a tomada de decisões. Seja para planejar um projeto ou visualizar uma ideia abstrata, este método manterá o seu trabalho claro e acionável.
Encontre o melhor modelo de mapa conceitual para você
Visualize fluxos de trabalho e simplifique os processos
Exemplo de mapa conceitual
Para ver como um mapa conceitual funciona na prática, vamos explorar um exemplo prático. Imagine que você está trabalhando em uma sessão de planejamento de projeto para o lançamento de um novo produto. Você precisa organizar ideias, acompanhar tarefas e gerir o fluxo de trabalho da sua equipe. Um mapa conceitual criativo pode ajudar a simplificar esse processo, mapeando visualmente cada fase do projeto.
Neste exemplo de mapa conceitual, o conceito central é “Lançamento do produto”. A partir daí, você pode dividi-lo em ramificações primárias, como “Estratégia de marketing”, “Desenvolvimento de produtos” e “Cronograma de lançamento”. Cada uma dessas ramificações pode ser dividida em subtópicos:
Estratégia de marketing: inclui tarefas como a criação de campanhas em redes sociais, a definição de públicos-alvo e a criação de materiais promocionais.
Desenvolvimento de produtos: concentra-se na finalização dos recursos do produto, na realização de testes e na coordenação com os fornecedores.
Cronograma de lançamento: descreve os principais marcos, como a versão beta, o lançamento limitado e o lançamento público completo.
Ao conectar esses conceitos-chave com setas ou linhas, a equipe pode ver como cada fase se relaciona com as outras. Por exemplo, a “Estratégia de marketing” deve estar alinhada com o “Cronograma de lançamento” para garantir que as campanhas estejam prontas a tempo para o lançamento do produto.
Noções básicas de mapeamento conceitual
O mapeamento conceitual começa com algumas etapas simples. Comece identificando a questão central: a ideia central ou o problema principal que você está tentando resolver. Isso serve de base para o seu mapa. A partir daí, divida a ideia central em conceitos menores e relacionados e use linhas ou setas para conectá-los visualmente.
Confira algumas dicas para um mapeamento conceitual eficaz:
Mantenha tudo organizado. Agrupe ideias semelhantes e certifique-se de que as conexões entre elas sejam claras.
Use as ferramentas certas. Considere usar um software que ofereça recursos como colaboração, facilidade de edição, integrações e atualizações em tempo real para simplificar o processo.
Mantenha a flexibilidade. Esteja aberto a ajustar o seu mapa à medida que surgirem novas ideias ou relações.
Comece de forma simples. Se você é iniciante no mapeamento conceitual, mantenha uma estrutura simples no início e expanda à medida que se sentir mais confortável.
Ao seguir estas boas práticas de mapeamento conceitual, você poderá criar um mapa que esclareça o seu pensamento e ajude a lidar com projetos complexos com facilidade.
Leve os seus mapas conceituais ao próximo nível
Todos os projetos fluem melhor com um planejamento adequado. Começar o seu processo com um mapa conceitual permitirá que você pense em possíveis opções, problemas e gargalos e os resolva antes que eles aconteçam. À medida que o projeto avança, usar o mapa conceitual em conjunto com a plataforma de gestão de projetos ajudará a manter o controle, os objetivos em vista e toda a equipe unida em direção a uma meta comum.
Perguntas frequentes: modelos de mapa conceitual
O que é mapeamento conceitual?
O mapeamento conceitual é uma técnica visual que ajuda a organizar e representar as informações com clareza. Ela divide ideias complexas em partes menores e gerenciáveis, conectando conceitos-chave e mostrando as relações entre eles. Ao exibir essas conexões visualmente, você pode ver o panorama geral e entender como as diferentes ideias se relacionam entre si. O mapeamento conceitual é útil para brainstorming, planejamento de projetos e resolução de problemas, o que o torna uma ferramenta funcional em contextos pessoais e profissionais.
Como criar um mapa conceitual?
Criar um mapa conceitual é bastante simples. Comece identificando a ideia principal e, em seguida, divida-a em conceitos ou subtópicos relacionados. Depois de fazer isso, use linhas ou setas para conectar essas ideias e mostrar como tudo se relaciona. Você pode criar um mapa conceitual manualmente, mas os modelos gratuitos da Asana cuidam da estrutura para que você possa se concentrar nas suas ideias e se organizar mais rapidamente.
Existe algum modelo de mapa conceitual no Word?
Infelizmente, o Word não vem com um modelo de mapa conceitual integrado. Embora seja possível criar um manualmente com SmartArt, formas e linhas, isso pode ser tedioso, especialmente se você estiver trabalhando com ideias complexas. Uma opção mais eficiente é usar a Asana. A Asana oferece modelos de mapa conceitual prontos que poupam tempo e facilitam a organização de ideias, a atribuição de tarefas e a colaboração, tudo em um só lugar.
O Google Docs tem um modelo de mapa conceitual?
O Google Docs não tem um modelo de mapa conceitual predefinido. É claro que você pode criar um manualmente usando a ferramenta de desenho com formas e linhas, mas essa não é a abordagem mais eficiente. Se você está procurando algo mais avançado, a Asana tem tudo o que você precisa. Com os modelos de mapa conceitual da Asana, você pode visualizar facilmente os fluxos de trabalho, gerir cronogramas e colaborar com a sua equipe, tudo isso com uma integração perfeita com o Google Workspace. É uma maneira mais rápida e eficaz de lidar com o planejamento de projetos.