


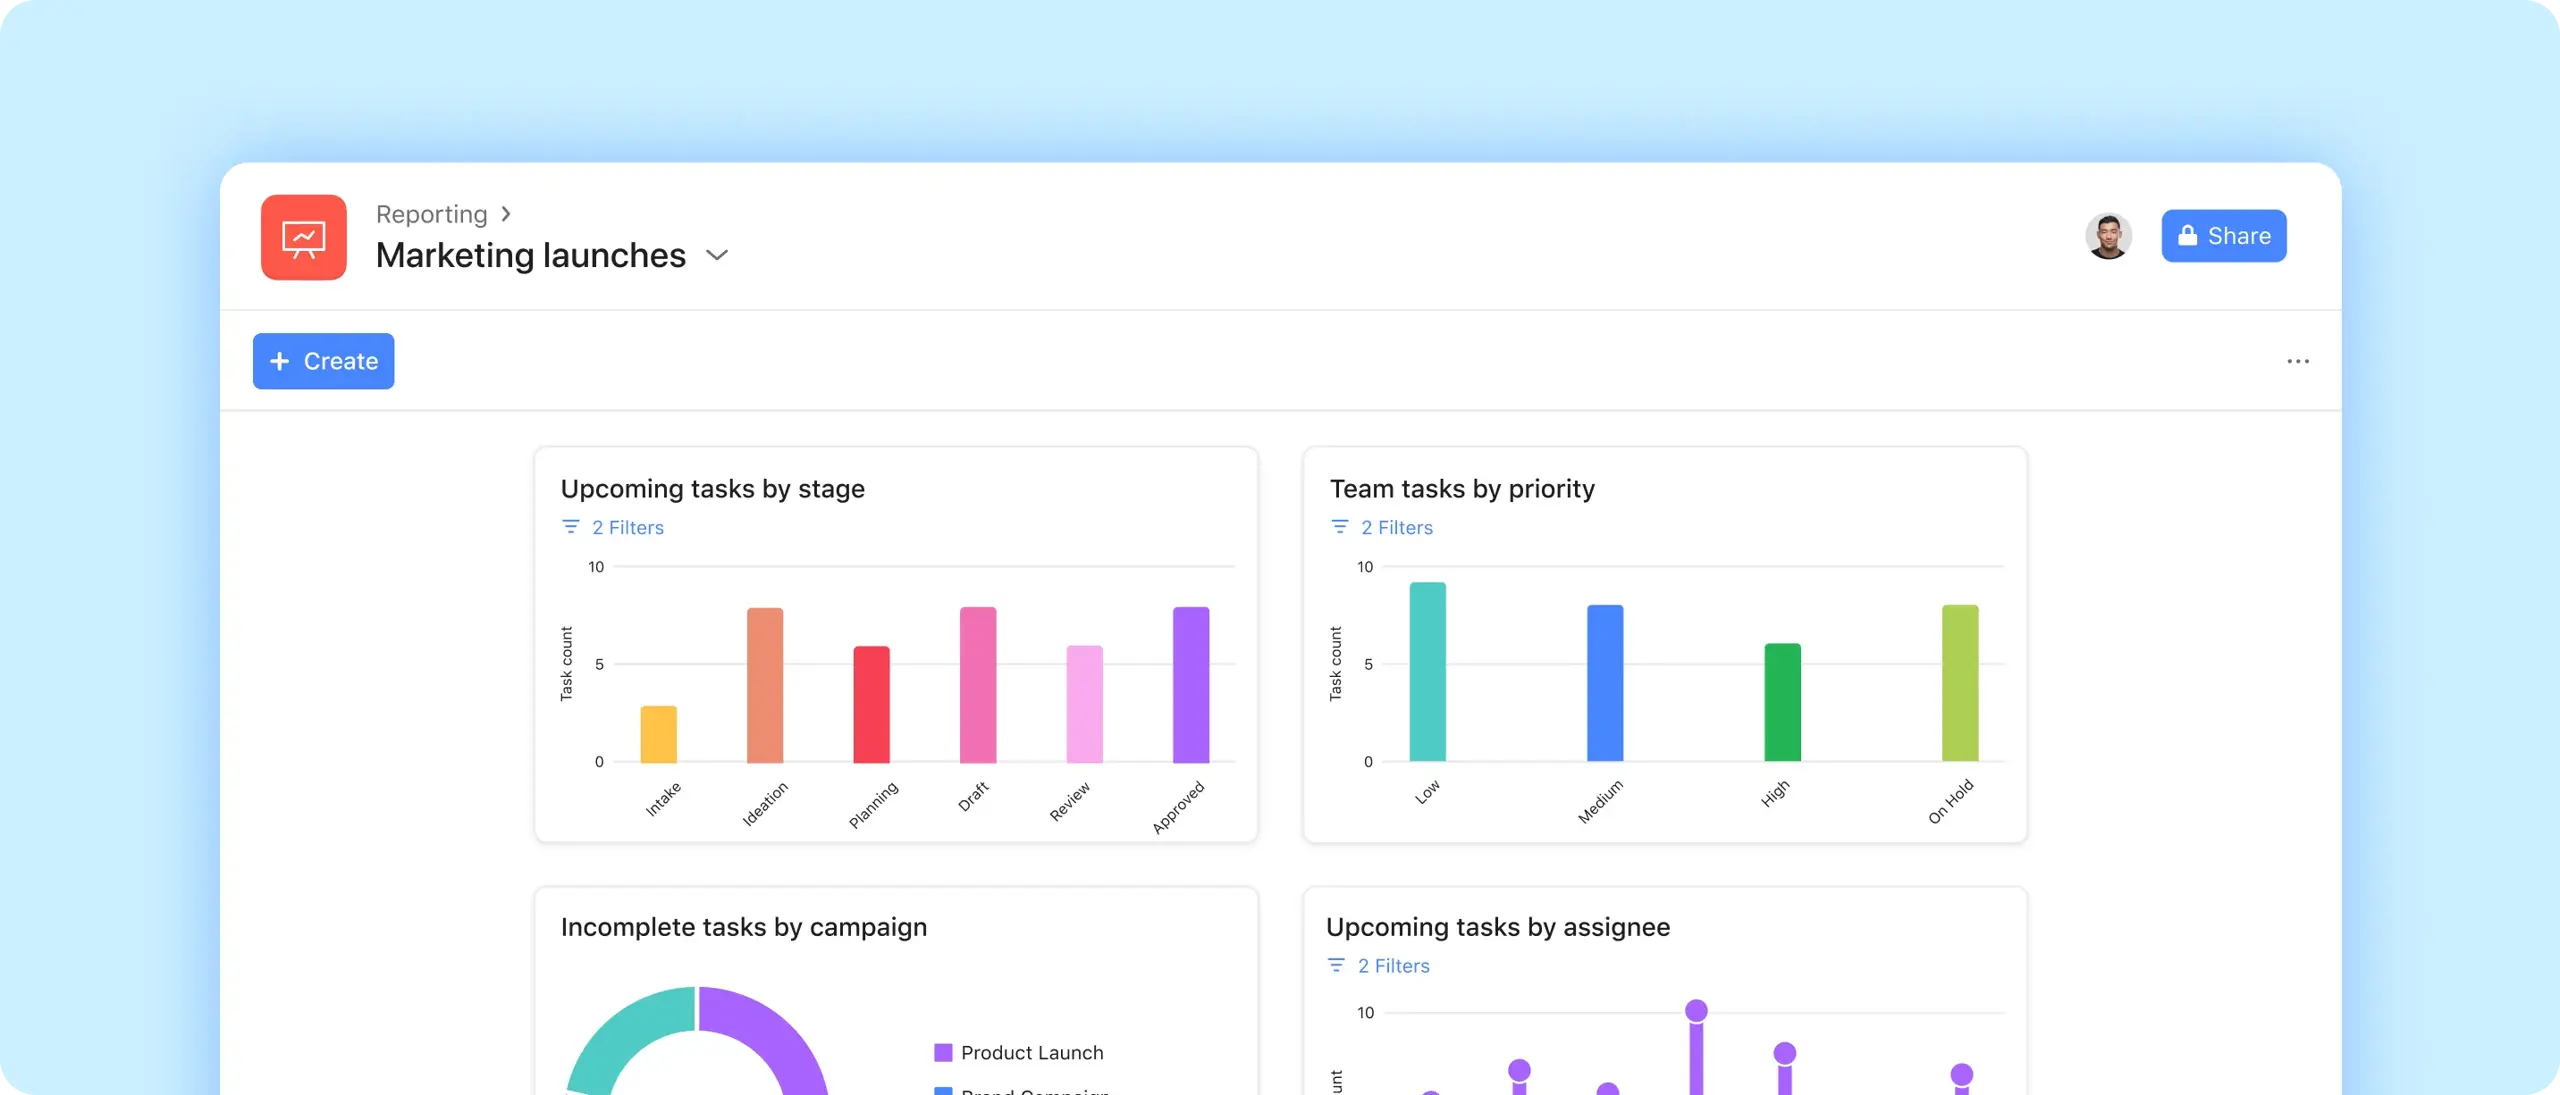
Lead with data
Create dashboards with a few clicks, so you can make the right decisions quickly.
Stay on track
Visualize data in different ways to find blockers and troubleshoot problems.
Jump right in
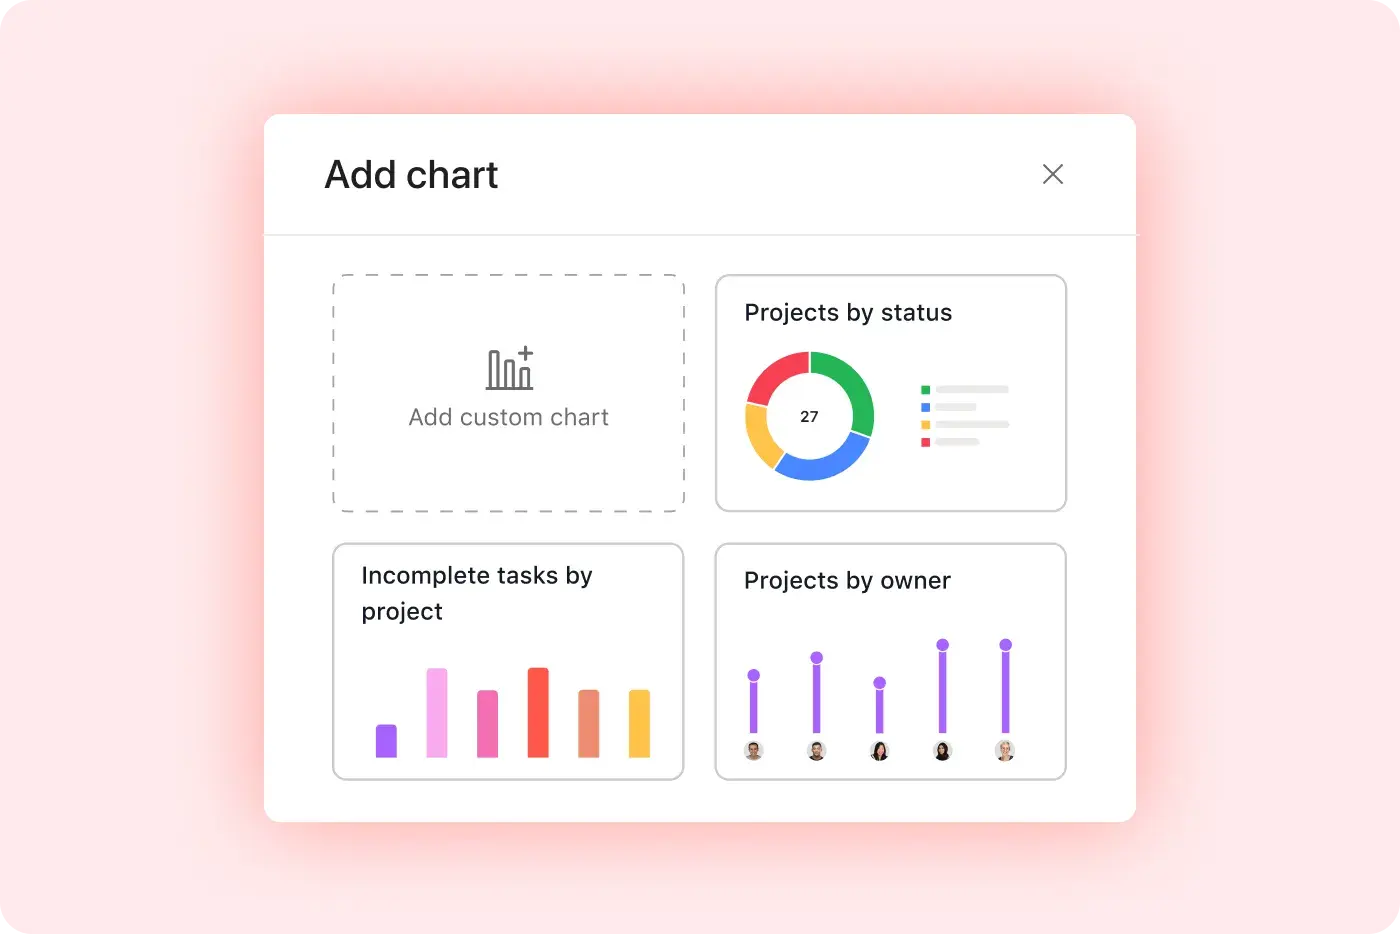
Get started quickly with chart templates—no reporting experience required.
Get the most relevant data for your business
Add charts with a click
Start with a template from our library, or customize your own.
See your work in a new way
Pull data from tasks, projects, or goals, then visualize it in different chart styles.
Filter your results
Choose a specific date range, exclude certain tasks, and more.

Turn information into insights
Monitor spending
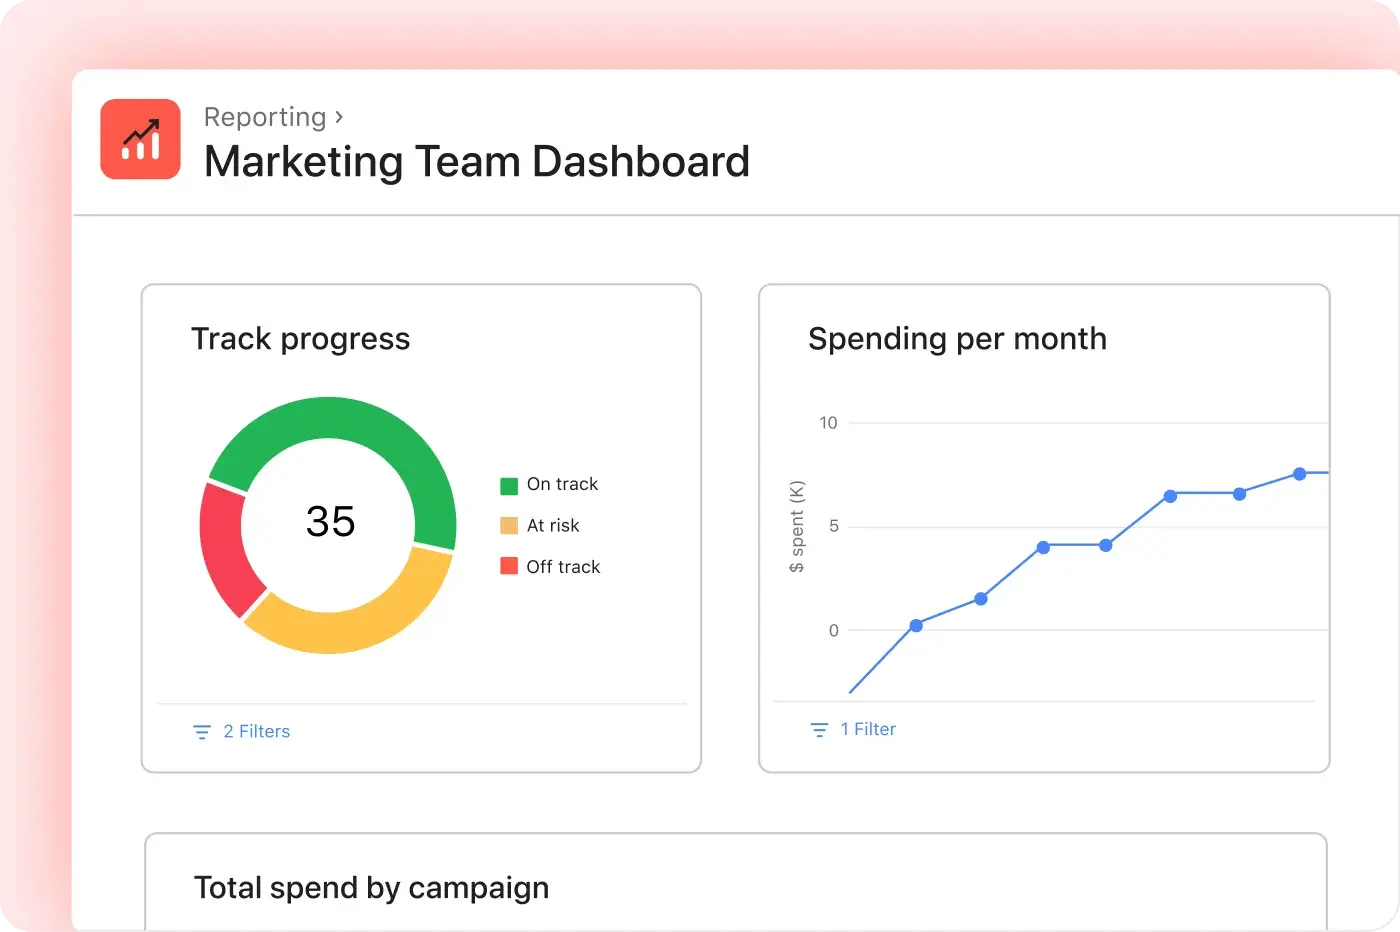
Create a line chart to show how project costs change over time.
Track progress
Use a donut chart to visualize the status of each task within a project.
See the big picture
Graph total revenue across projects at your organization.

Discover underlying trends and take action
Go to the source
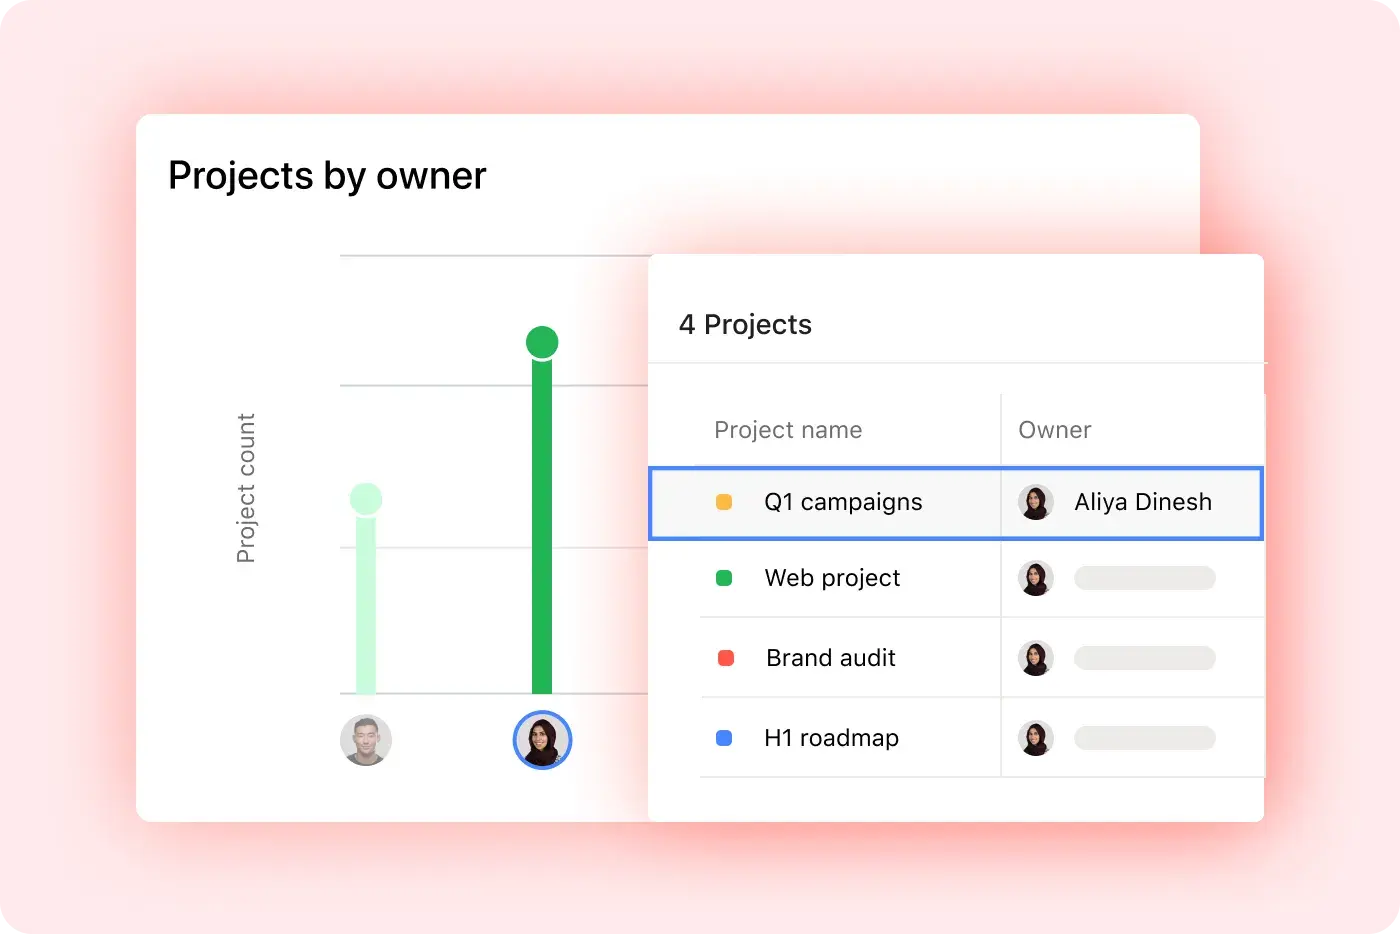
Click on any data point to find the underlying goals, projects, or tasks you need to unblock.
Share insights
Keep your dashboard private, or share it with specific team members.


Размер компании
Enterprise
Отрасль
Еда и гостеприимство
Asana gives me the ability to quickly create charts, track status, and zoom in on certain aspects of a project without having to export the data to spreadsheets.
Céline Pradels Gillet
Global Transformation Director, Danone
Put it all together
Reporting dashboards are just the start. Combine them with these features and stay on track to hit your business targets.
Остались вопросы? Мы ответим на них.
The Asana plans that include reporting dashboards are Starter, Advanced, Enterprise, and Enterprise+ plans. Project dashboards are Starter+, portfolio dashboards are Advanced+, and universal reporting is Advanced+.
The types of charts you can build include column, line, burn-up, donut, number, and lollipop charts to visualize different data aspects.
Charts are customizable in Asana. Dashboards support custom charts that you can configure by selecting inputs, filters, and visual styles.
You can share reporting dashboards with teammates by sharing dashboards with specific teammates who are eligible under your plan. Shared users need appropriate access to view them.
You can pull data across multiple projects or portfolios by creating project-level, portfolio-level, or universal dashboards that pull data from tasks, projects, portfolios, and goals.
To create dashboards quickly, you can use ready-made chart templates to build dashboards with a few clicks—even without prior reporting experience.
You can filter dashboard data by date or tasks in Asana. Dashboards allow filtering by specific date ranges, excluding tasks, and other criteria to surface the most relevant data.
You can click into dashboard charts for more detail. Each chart is interactive—clicking a data point takes you to the exact tasks, projects, or goals it references.
Dashboards offer real-time insights on blockers or spending in Asana. Dashboards deliver real-time visuals on project health, blocker trends, and spending over time with configurable charts.
There is support for third-party or advanced reporting through exports and integrations. For deeper analytics or custom reporting, users often export to BI tools (e.g., Power BI, Looker Studio) or use third-party integrations like Coupler.io.
Измените свой стиль работы с помощью Asana
Начните пробный период
Попробуйте Asana бесплатно. Данные кредитной карты не требуются.
Смотреть демо
Узнайте, как Asana объединяет компании в больших масштабах.
Поговорить с торговым представителем
Узнайте, как Asana помогает командам эффективно взаимодействовать.