Apa itu pemetaan aliran nilai (VSM)?

Ringkasan
Saat Anda menata lemari yang berantakan, langkah pertama adalah mengeluarkan semuanya dari ruang tersebut. Mengeluarkan semuanya akan memberi Anda gambaran yang lebih jelas tentang apa yang Anda miliki, sehingga lebih mudah untuk menata ulang.
Peningkatan pekerjaan serupa karena sulit untuk melihat inefisiensi tanpa menata semuanya di depan Anda. Melakukan hal ini dengan alur kerja dapat mengungkapkan masalah yang sebelumnya tidak Anda sadari—di situlah pemetaan aliran nilai berguna.
Apa itu pemetaan aliran nilai?
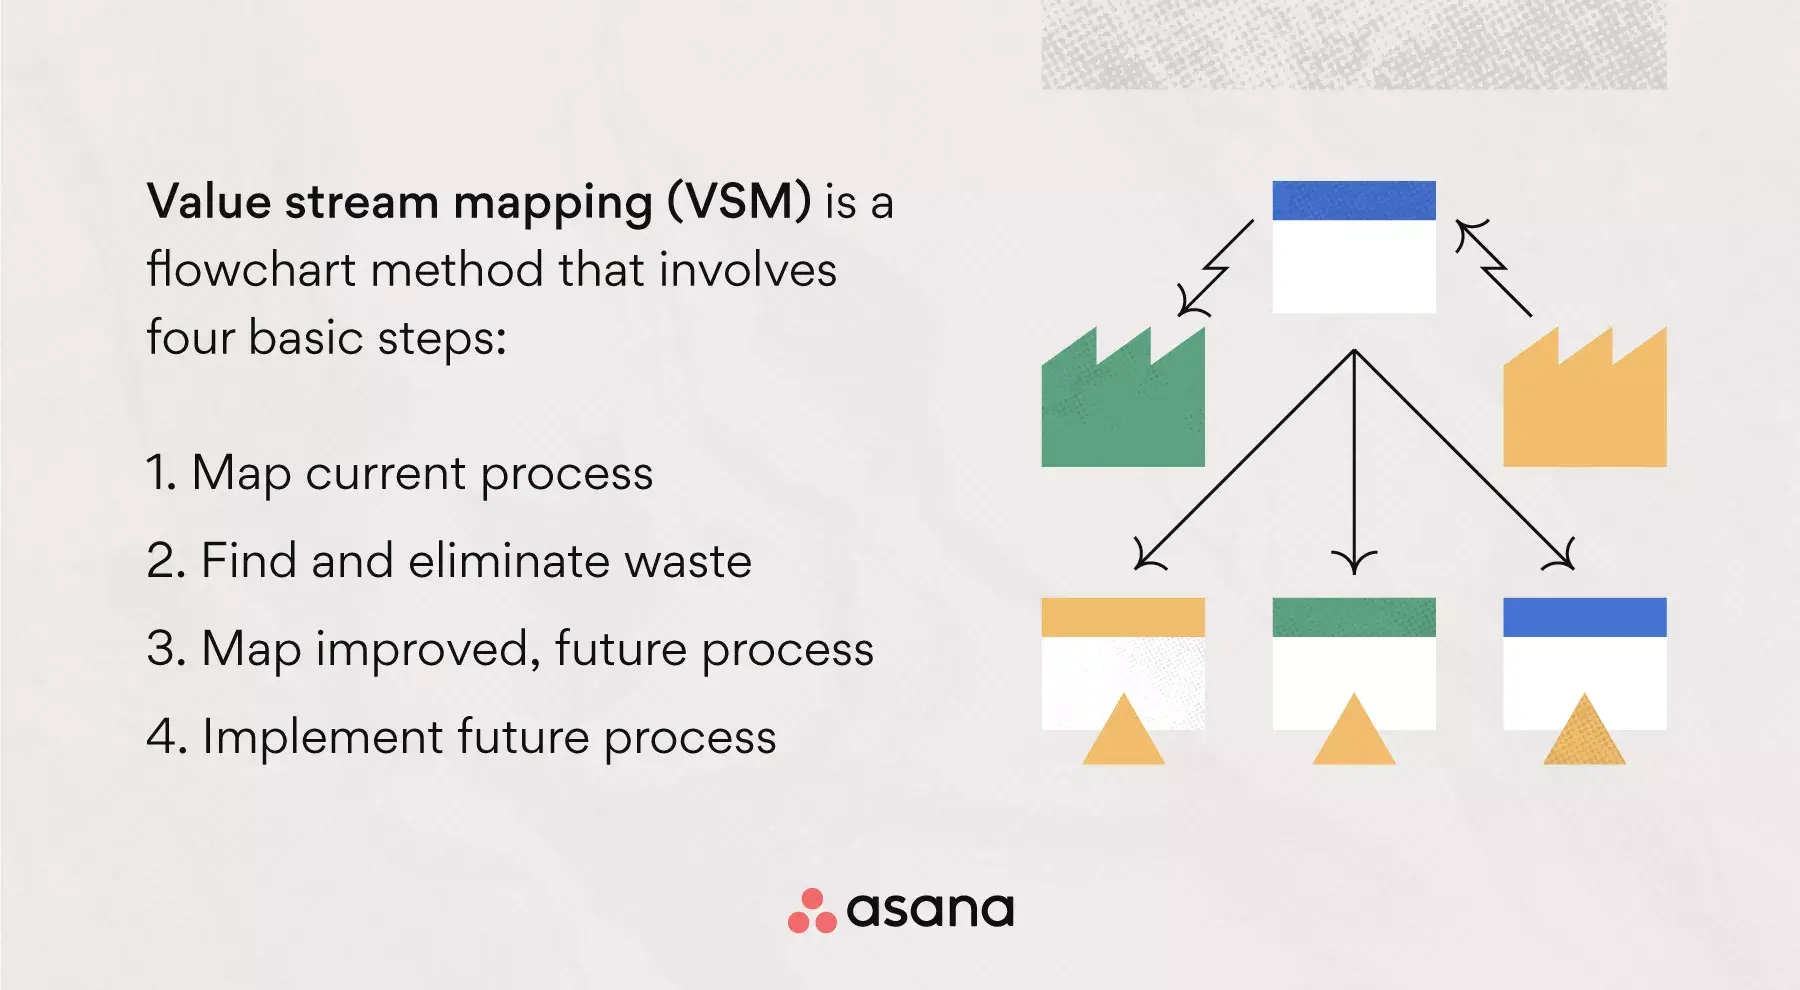
Pemetaan aliran nilai adalah metode bagan alir yang digunakan untuk menggambarkan dan menganalisis proses produksi. VSM adalah komponen utama dalam manajemen proyek lean —metodologi Agile yang meningkatkan nilai pelanggan dengan menghilangkan pemborosan dari setiap fase proyek.
Pemetaan aliran nilai (VSM) meliputi empat langkah dasar:
Petakan proses saat ini
Menemukan dan menghilangkan pemborosan
Memetakan proses masa depan yang lebih baik
Menerapkan proses mendatang
Anda mungkin melihat ruang untuk peningkatan di bidang peta aliran nilai Anda, seperti:
Alur proses
Waktu lead dan pemrosesan
Keandalan peralatan
Bahan baku/inventaris
Saat menemukan pemborosan dalam alur produksi, seperti produksi berlebih, kesalahan manajemen, atau cacat proyek, Anda dapat mengelola kemacetan ini agar proses Anda berjalan lancar.
Alat pengambilan keputusan untuk bisnis agile
Dalam buku-el ini, pelajari cara membekali pegawai untuk mengambil keputusan yang lebih baik—sehingga bisnis Anda dapat menyesuaikan, beradaptasi, dan mengatasi tantangan dengan lebih efektif daripada pesaing Anda.


Kapan Anda harus menggunakan pemetaan aliran nilai?
Pemetaan aliran nilai dapat menghasilkan peningkatan yang signifikan dalam model Business Anda. Namun, Anda tidak perlu menginvestasikan waktu dan sumber daya untuk VSM jika tidak sesuai dengan kebutuhan Anda. Berikut situasi saat Anda harus menggunakan pemetaan nilai:
Untuk meningkatkan proses kerja end-to-end
Untuk mengidentifikasi inventaris yang menumpuk dalam suatu proses
Untuk menemukan peluang optimasi proses
Untuk mempelajari kompleksitas yang melekat pada suatu proses
Untuk memahami sistem TI yang digunakan dalam suatu proses
Untuk menilai efektivitas saluran layanan pelanggan
Untuk menampilkan kesehatan proses Anda secara visual
Untuk meninjau proses Anda secara strategis
Seperti yang Anda lihat, membuat peta aliran nilai memberikan wawasan tentang berbagai aspek proses kerja. Namun, peta nilai mungkin tidak membantu jika Anda mencoba memecahkan masalah yang tidak terkait dengan informasi, produk, atau alur waktu.
Cara membuat peta aliran nilai
Pemetaan aliran nilai memiliki empat langkah dasar, tetapi Anda akan merasa lebih siap jika memperluas proses menjadi sembilan langkah. Lima langkah pertama dalam proses VSM berfokus pada perencanaan proyek. Memiliki rencana proyek akan meningkatkan wawasan Anda dan dapat menghasilkan peningkatan proses yang lebih baik. Kemudian, Anda dapat memulai empat langkah dasar VSM dengan semua konteks yang dibutuhkan.
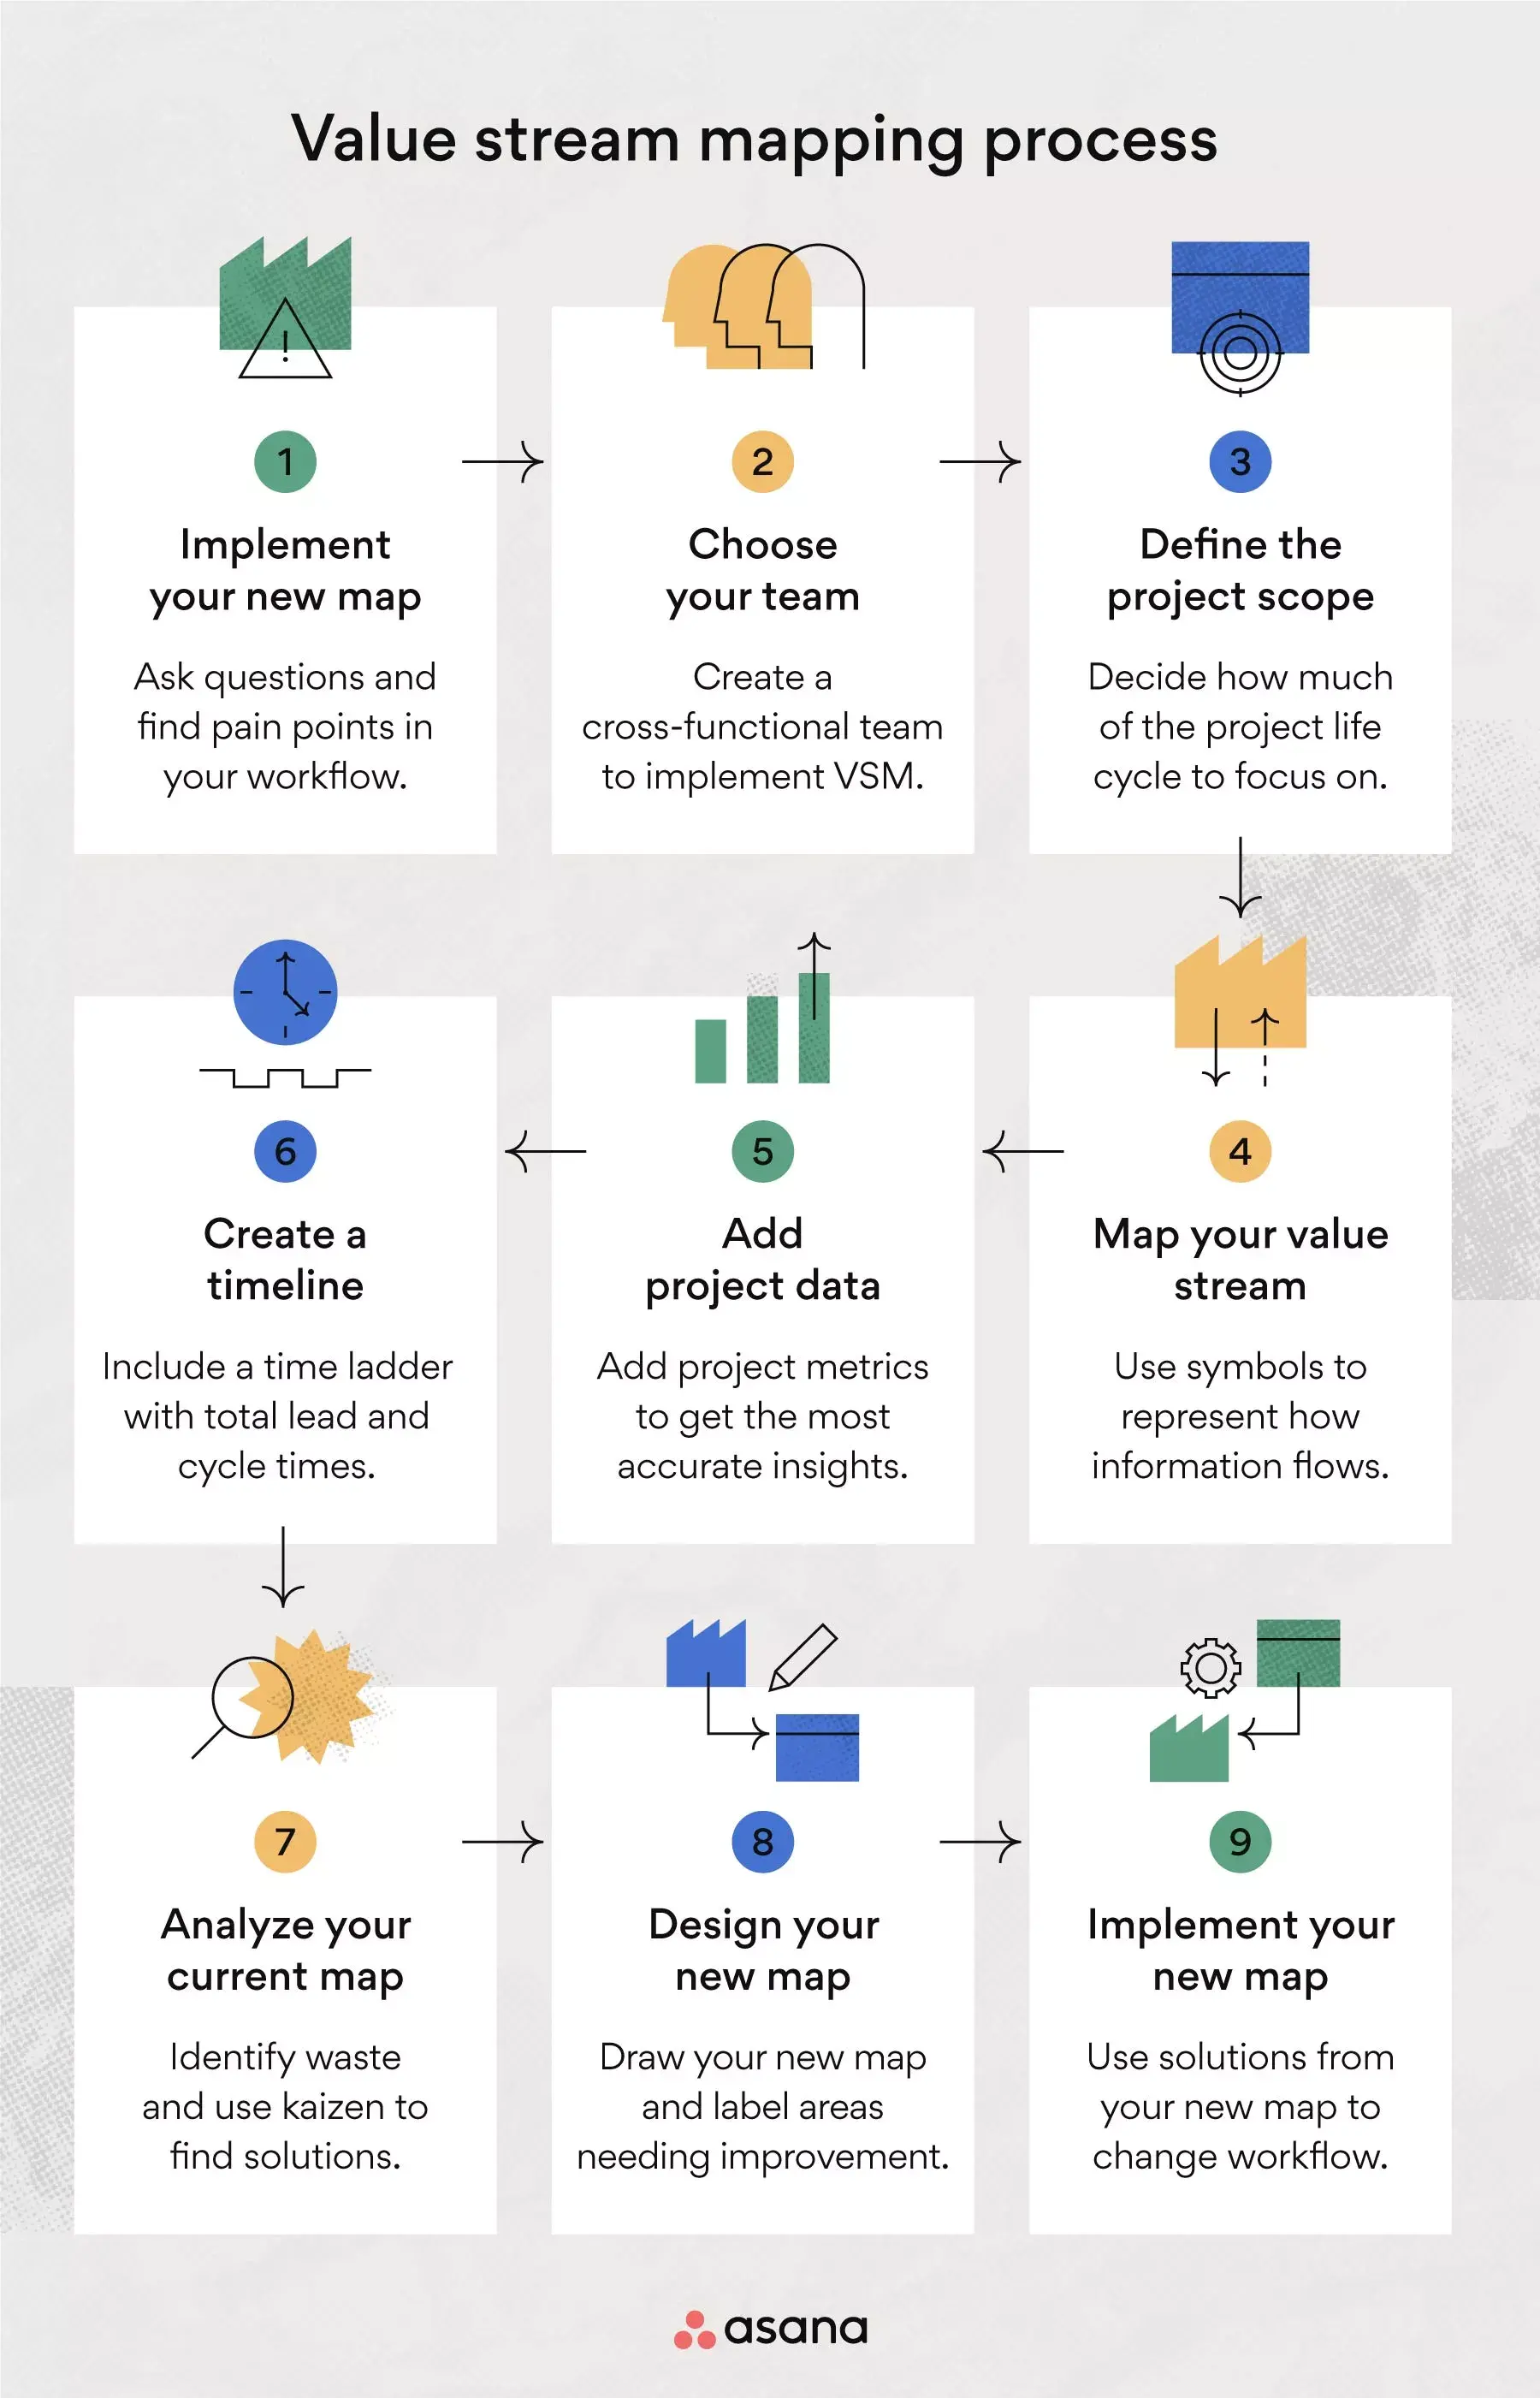
1. Identifikasi masalah
Pemetaan alur nilai adalah bagian penting dari pemeliharaan alur kerja rutin, tetapi Anda juga dapat menggunakannya untuk memecahkan masalah tim atau pelanggan yang sudah Anda ketahui. Misalnya, Anda mungkin melihat bahwa permintaan pelanggan lebih tinggi daripada jumlah stok inventaris yang tersedia. Saat Anda melihat masalah, tetapi tidak tahu penyebabnya, Anda dapat membagikan masalah tersebut kepada tim dan menggunakan VSM untuk menemukan solusi.
Kiat: Pada tahap awal ini, lakukan curah pendapat dan ajukan pertanyaan untuk mengidentifikasi inefisiensi internal dan eksternal. Tempatkan diri Anda pada posisi pelanggan dan anggota tim sehingga Anda dapat menemukan titik masalah.
2. Pilih Tim Anda
Anda memerlukan tim yang bertekad dan fokus untuk membantu memetakan aliran nilai, menganalisisnya secara cermat, dan menerapkan proses produksi yang lebih baik. Tim lintas fungsi yang terdiri dari anggota bagian penjualan, operasi, layanan pelanggan, dan desain akan memberi Anda keterampilan dan perspektif yang dibutuhkan untuk mengoptimalkan waktu proses dan memenuhi kebutuhan pelanggan. Tergantung pada masalah yang ingin diselesaikan, Anda mungkin tidak memerlukan perwakilan dari semua tim ini. Pilih dengan bijaksana untuk menjadikan tim VSM Anda seefisien mungkin.
Kiat: Pekerjakan eksekutif dan mereka yang memiliki peran pendukung di tim VSM Anda untuk meningkatkan visibilitas ke masalah internal. Undang pemasok atau pemangku kepentingan lainnya untuk bergabung ke grup Anda jika Anda menginginkan sudut pandang pihak luar.
3. Tentukan ruang lingkup proyek
Latihan pemetaan alur nilai Anda adalah proyek tersendiri, yang berarti Anda harus menentukan ruang lingkupnya. Jika tidak menentukan ruang lingkup proyek, Anda tidak akan tahu berapa banyak proses kerja yang harus dipetakan. Kurangnya ruang lingkup yang jelas juga mempersulit identifikasi dan penghapusan pemborosan nantinya.
Kiat: Hanya gunakan VSM untuk satu produk pada satu waktu. Tentukan apakah akan memetakan seluruh siklus produk atau berfokus pada langkah-langkah proses tertentu. Jika Anda membuat produk perangkat lunak, Anda dapat memetakan proses dari permintaan fitur awal hingga pengiriman kepada pelanggan. Abaikan langkah-langkah bersyarat yang mungkin terjadi setelah pelanggan menerima produk.
4. Petakan aliran nilai Anda
Setelah menentukan ruang lingkup VSM, Anda dapat memulai pemetaan. Gunakan simbol alur nilai (dijelaskan di bawah) untuk menunjukkan cara informasi mengalir antaraktivitas kerja Anda. Jika Anda memetakan seluruh proses produksi, peta Anda akan membuat lingkaran. Tahap akhir dari proses produksi harus kembali ke langkah proses awal.
Kiat: Jika Anda tidak yakin harus memulai peta aliran nilai dari mana, mulailah dengan anggota tim yang bertanggung jawab menyetujui permintaan antara pelanggan dan pemasok. Anda juga dapat memvisualisasikan peta dalam tiga bagian. Alokasikan bagian atas peta untuk alur informasi, bagian tengah untuk alur produk, dan bagian bawah untuk alur waktu.
5. Tambahkan data proyek
Setelah memiliki ilustrasi aliran nilai, tambahkan metrik yang relevan untuk mendapatkan wawasan yang paling akurat dari latihan ini. Meskipun peta saja dapat membantu Anda memvisualisasikan hal-hal tertentu, seperti proses manufaktur atau pengembangan perangkat lunak perusahaan, Anda harus memasangkan gambar dengan kotak data untuk membandingkan hal-hal seperti waktu, kuantitas, dan kualitas di antara semua langkah proses.
Poin data yang dapat Anda tambahkan ke peta meliputi:
Jumlah inventaris yang disimpan untuk setiap langkah
Waktu siklus per unit
Waktu transfer
Jumlah anggota tim yang diperlukan untuk melakukan setiap langkah
Jumlah produk yang dibuang
Jumlah produk di setiap batch pemrosesan
Waktu takt (kecepatan yang diperlukan untuk menghasilkan produk guna memenuhi permintaan pelanggan)
Kiat: Data yang Anda sertakan dalam peta akan bervariasi tergantung industri Anda, proses yang Anda petakan, dan masalah yang ingin Anda pecahkan. Sebagian besar data akan berada dalam tiga kategori berikut:
Data kantor atau dukungan
Data manufaktur atau toko
Data pemasok atau pemrosesan eksternal
6. Buat linimasa
Linimasa yang jelas sangat penting untuk setiap proses produksi, dan penundaan dapat mengganggu seluruh Alur Kerja Anda. Anda akan mengalokasikan sepertiga bagian bawah peta aliran nilai untuk alur waktu menggunakan tangga waktu, yang memiliki dua anak tangga untuk waktu tunggu dan waktu siklus. Tangga ini akan memberi Anda gambaran yang lebih jelas tentang apakah waktu tunggu dan waktu siklus sesuai kecepatan.
Waktu tunggu adalah total waktu yang dibutuhkan tim untuk menyelesaikan tugas, dimulai saat tugas pertama kali memasuki alur kerja Anda. Waktu tunggu mencakup semua proses operasional yang mengarah ke tahap produksi yang sebenarnya.
Waktu siklus adalah bagian dari total waktu tunggu saat Anda benar-benar menyelesaikan tugas. Ini kadang dikenal sebagai waktu bernilai tambah.
Hitung waktu tunggu dengan menghitung persediaan yang tersedia sebelum setiap langkah proses dan membaginya dengan permintaan pelanggan untuk produk tersebut. Contohnya, bayangkan Anda memiliki empat produk yang tersedia sebelum memasuki langkah proses pengiriman dan permintaan pelanggan untuk produk tersebut adalah dua produk per hari, maka waktu tunggu Anda adalah dua hari.
Kiat: Waktu lead terkait erat dengan manajemen inventaris dan kepuasan pelanggan. Jika waktu tenggang terlalu lama, Anda akan kesulitan memprediksi kapan harus mengisi ulang inventaris. Peta aliran nilai dapat membantu Anda mengoptimalkan lead time sebelum Anda mengalami keterlambatan dalam pengiriman produk.
7. Analisis peta Anda saat ini
Saat membuat peta alur saat ini, Anda mungkin akan melihat area yang perlu dioptimalkan. Untuk menyelesaikan peta aliran nilai, isi dengan data proyek agar area pemborosan lebih terlihat.
Namun, meskipun area pemborosan tampak jelas, Anda tetap harus mengatur waktu fokus untuk analisis peta. Area pemborosan dalam manajemen lean meliputi:
Produksi berlebihan (fitur yang tidak perlu)
Inventaris (backlog yang tidak dikelola dengan baik)
Gerakan (peralihan tugas)
Cacat (utang teknis)
Pemrosesan berlebihan (alat mahal)
Menunggu
Transportasi
Tim yang terfragmentasi
Kiat: Cara terbaik untuk menganalisis peta Anda adalah dengan melakukan ledakan kaizen pada area pemborosan yang telah diidentifikasi. Kata kaizen berasal dari dua kata dalam bahasa Jepang: kai, yang berarti peningkatan, dan zen, yang berarti baik. Kedua kata tersebut jika digabungkan menciptakan gagasan peningkatan berkelanjutan. Anda akan menggunakan ledakan kaizen untuk menghasilkan ide yang memberi nilai tambah untuk peta aliran nilai kondisi masa depan.
8. Rancang peta baru Anda
Sekarang Anda siap menggambar peta alur nilai keadaan masa depan. Peta ini akan terlihat mirip dengan peta saat ini, tetapi menyertakan elemen kaizen untuk area yang membutuhkan peningkatan. Anda dapat menggunakan perangkat lunak Kanban untuk menerapkan sumber daya penarikan—atau penarikan hanya saat permintaan membutuhkannya—dan meningkatkan alur informasi Anda.
Simbol spesifik yang Anda tambahkan ke peta kondisi masa depan akan bervariasi, tergantung proses Anda. Lihat peta simbol VSM di bawah ini untuk representasi visual dari hal berikut:.
Supermarket: Merepresentasikan titik stok Kanban tempat pelanggan dapat memperoleh inventaris yang dibutuhkan segera setelah pemasok mengisinya kembali.
Kanban Produksi: Menunjukkan kebutuhan produk untuk memasok suku cadang ke proses hilir.
Kanban penarikan material: Menginstruksikan operator untuk memindahkan suku cadang dari supermarket ke suatu proses.
Kanban Sinyal: Digunakan saat tingkat inventaris di supermarket rendah, dan menandakan produksi sejumlah suku cadang tertentu.
Pos Kanban: Menunjukkan lokasi untuk mengumpulkan sinyal Kanban, biasanya terletak di dekat supermarket.
Penarikan material: Merepresentasikan penghapusan inventaris yang disimpan dari supermarket.
Penarikan berurutan: Menghilangkan kebutuhan penyimpanan inventaris supermarket antarproses dengan menginstruksikan tim tertentu untuk menghasilkan pesanan kustom.
Kiat: Gunakan peta simbol alur nilai di bawah ini untuk melihat tampilan setiap simbol dan menempatkannya di peta status masa depan Anda. Meskipun gol peta kondisi masa depan Anda adalah menyederhanakan alur material, jangan khawatir jika peta kondisi masa depan Anda terlihat lebih padat daripada peta kondisi saat ini karena simbol yang telah Anda tambahkan.
9. Terapkan peta baru Anda
Langkah terakhir dalam proses VSM adalah menerapkan solusi dari peta kondisi masa depan ke dalam proses kerja Anda. Di sinilah Anda akan melihat hasil analisis peta Anda.
Seperti menata lemari, memilah-milah kekacauan terasa kacau, tetapi tujuan proyek menjadi jelas setelah Anda merasakan kemudahan menggunakan ruang fungsional yang baru. Meskipun mengidentifikasi pemborosan dan menemukan solusi yang lebih ramping itu sulit, produk akhirnya adalah Alur Kerja yang lebih efisien dan pelanggan yang lebih bahagia.
Alat pengambilan keputusan untuk bisnis agile
Dalam buku-el ini, pelajari cara membekali pegawai untuk mengambil keputusan yang lebih baik—sehingga bisnis Anda dapat menyesuaikan, beradaptasi, dan mengatasi tantangan dengan lebih efektif daripada pesaing Anda.
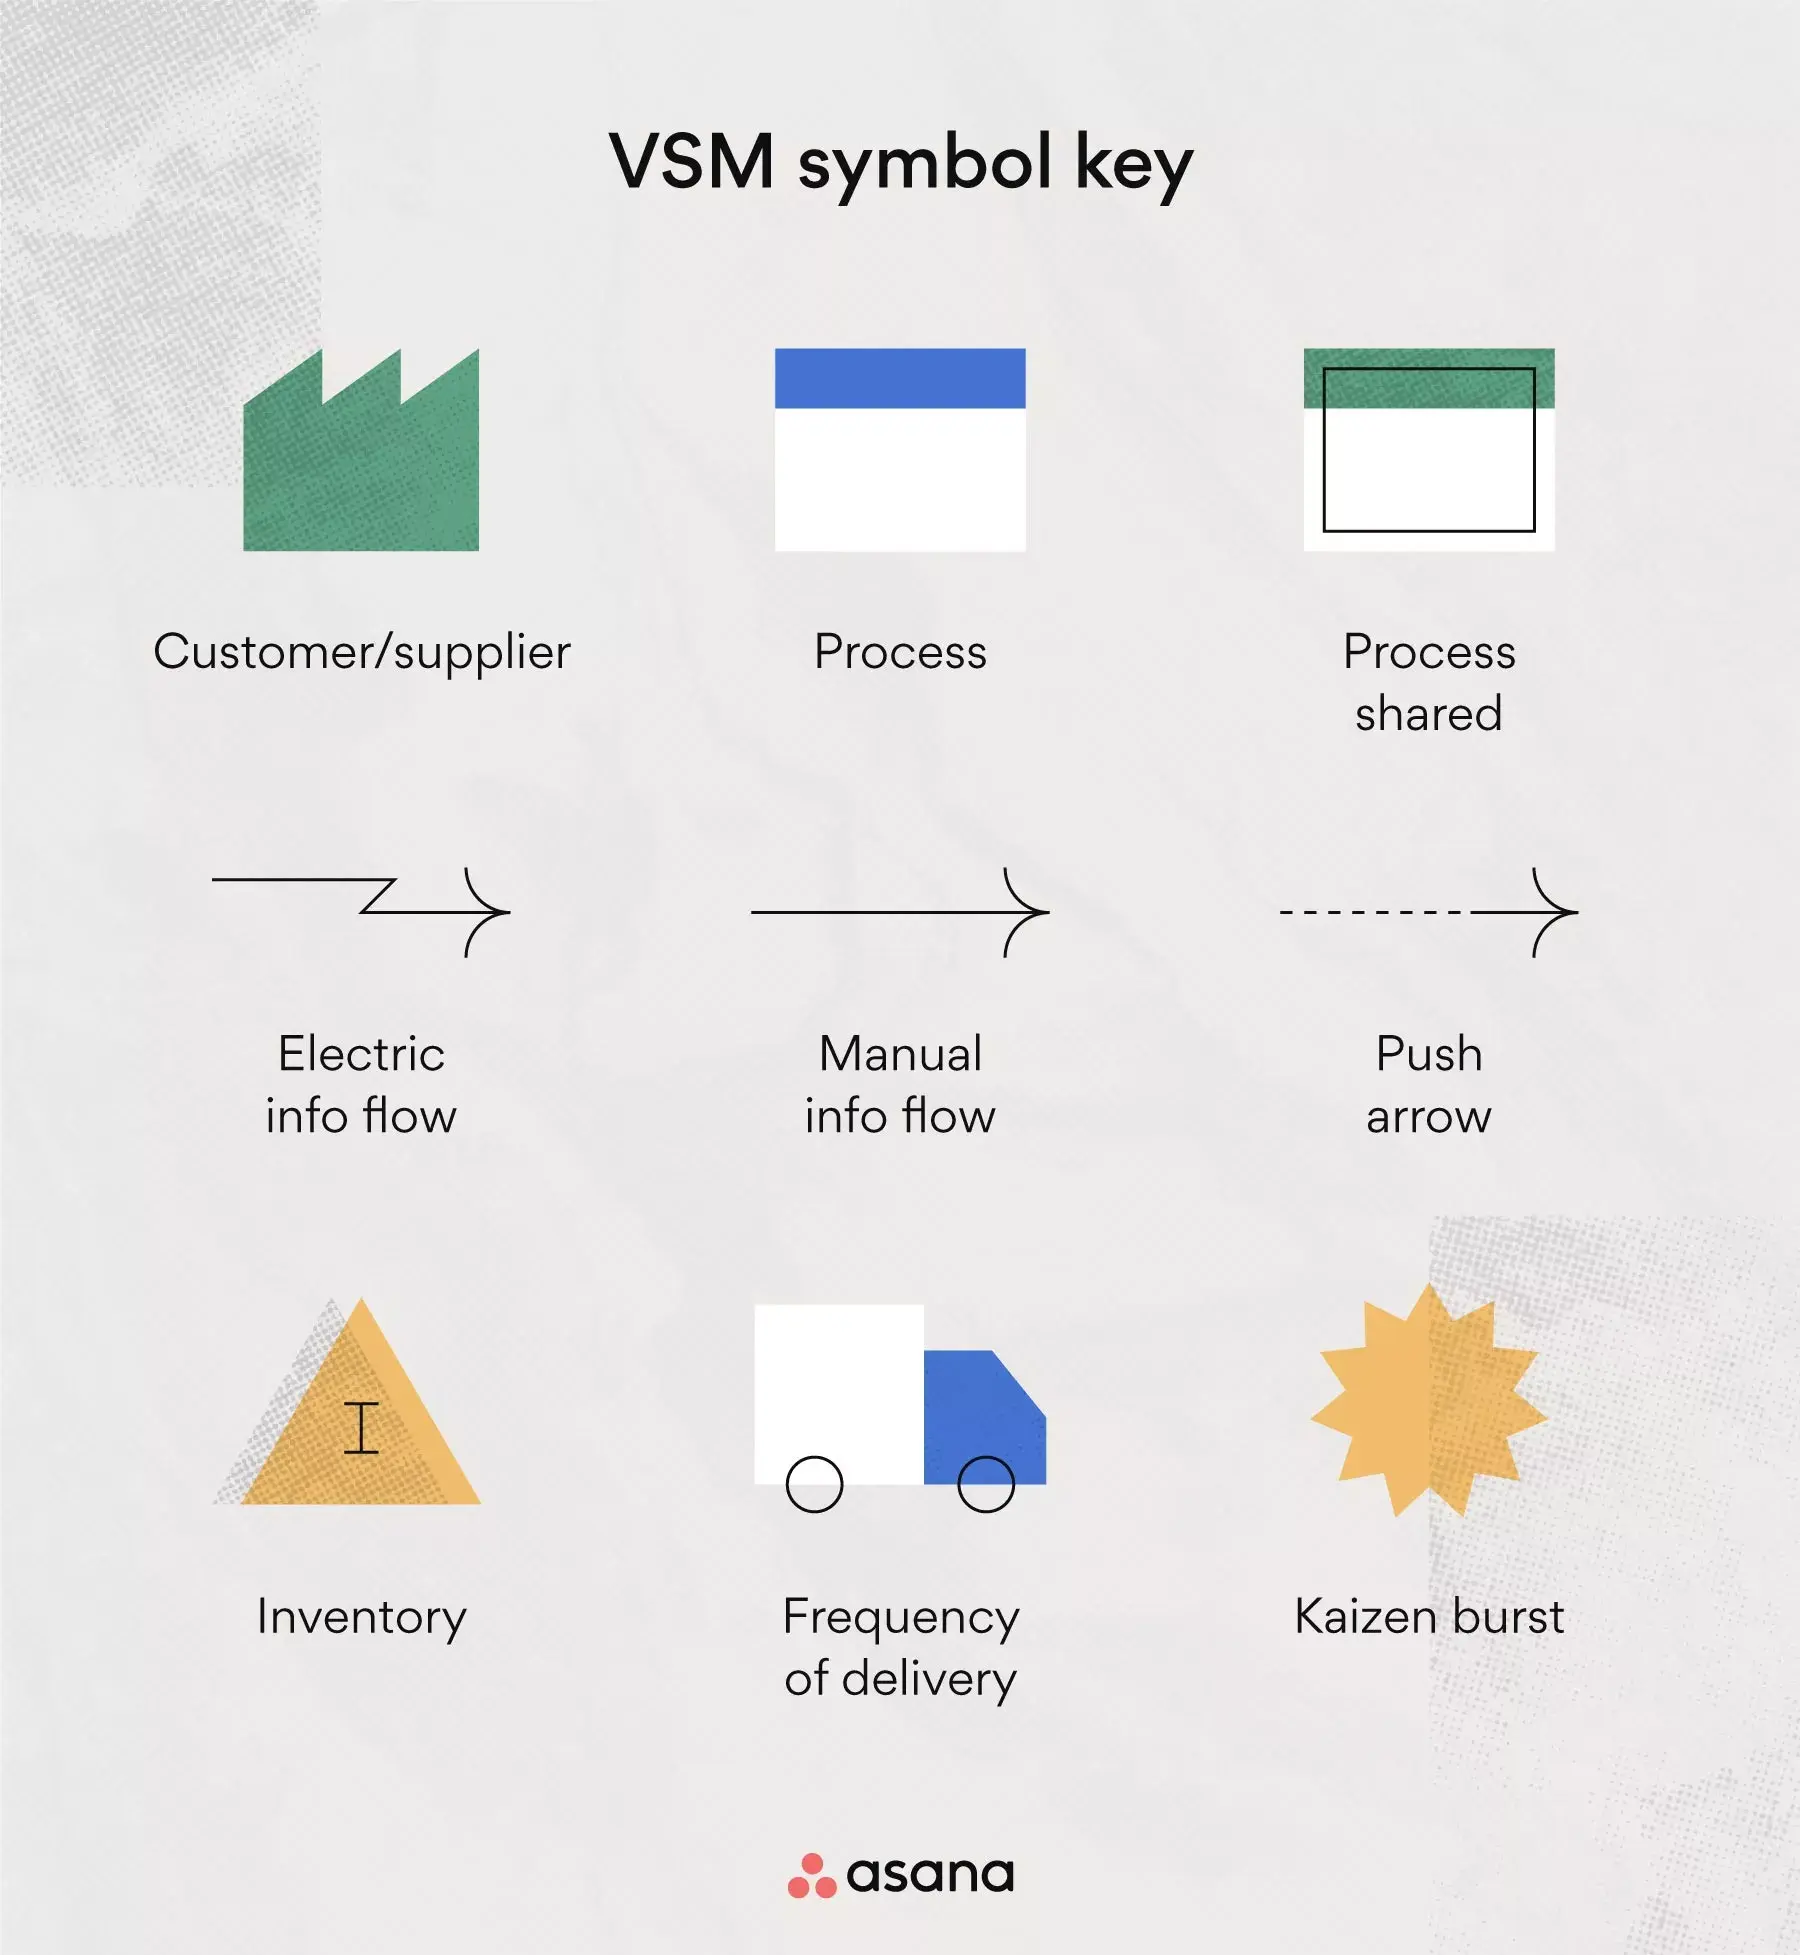
Peta simbol aliran nilai
Simbol berikut mewakili alur informasi, aktivitas kerja, dan area yang perlu ditingkatkan dalam proses Anda. Saat menggunakan perangkat lunak VSM, Anda akan memiliki bank simbol ini yang siap digunakan.
Contoh pemetaan aliran nilai
Di bawah ini, Anda akan melihat contoh VSM dari peta kondisi saat ini. Peta ini menguraikan proses produk atau layanan yang berpindah dari pemasok, melalui rantai produksi internal, dan ke pelanggan.
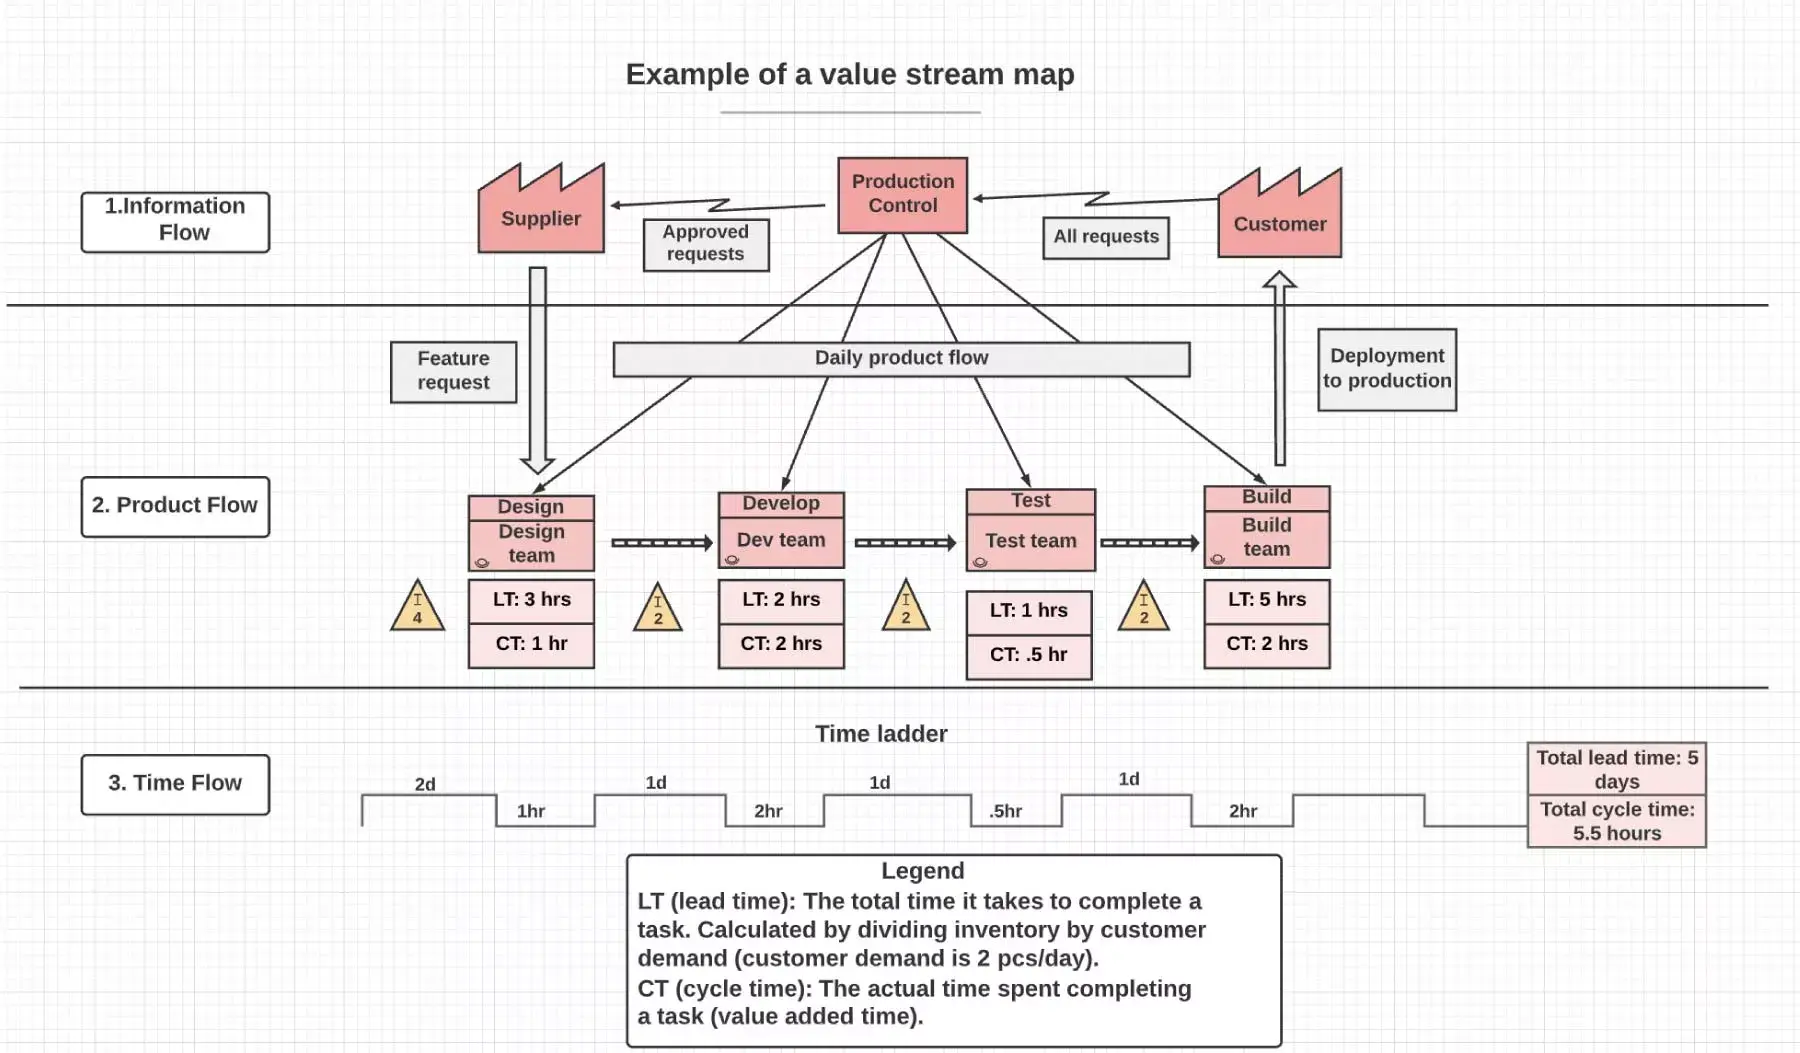
Peta aliran nilai dimulai dari bagian atas tengah dengan anggota tim yang bertanggung jawab atas kontrol produksi. Orang ini menyetujui permintaan atau pesanan dari pelanggan dan mengirimkan permintaan ini ke pemasok. Perhatikan bahwa contoh peta aliran nilai ini berjalan dalam gerakan melingkar karena permintaan pelanggan memenuhi rantai pasokan dan produksi.
Buat alur kerja yang efisien dengan pemetaan aliran nilai
Jika Anda mengupayakan peningkatan berkelanjutan, lakukan pemeliharaan rutin terhadap proses Anda, seperti yang Anda lakukan dengan Beranda Anda. Meskipun VSM mungkin terasa membosankan, hasilnya adalah Alur Kerja yang lebih efisien dengan lebih sedikit pemborosan dan waktu tunggu yang lebih singkat.
Memetakan aliran nilai saat ini dan mendatang lebih mudah saat menggunakan perangkat lunak yang tepat. Saat mengintegrasikan peta aliran nilai dengan Asana, Anda dapat dengan cepat menerapkan solusi dan kembali memuaskan pelanggan.
Alat pengambilan keputusan untuk bisnis agile
Dalam buku-el ini, pelajari cara membekali pegawai untuk mengambil keputusan yang lebih baik—sehingga bisnis Anda dapat menyesuaikan, beradaptasi, dan mengatasi tantangan dengan lebih efektif daripada pesaing Anda.